A
case of the Hum being a tale of two sub-stations,
by
Dr Chris Barnes
Abstract
The
Hum is defined and what is known about it briefly reviewed. Copies of acoustic
measurement spectra printouts have been provided to the author said copies were
obtained by a local authority in relation to a noise complaint associated with
the Hum in Charlbury.
A frequency analysis of these measurements has been made. It is shown
that the greater part of the acoustic spectrum present in the complainant’s
premises can be accounted for by the spectrum recorded at two nearby sub-stations and under an
electricity pylon outside the complainant’s premises. An unusually high acoustic signal at 100 Hz
is found within the premises with the electricity supply to the premises
switched off. Possible reasons for this
are discussed. The great majority of
frequencies present at the premises are also features of the
Introduction
The Hum is a term given to a modern and relatively
unexplained LFN phenomenon (1). The
first academic publication on the Hum, Deming, blamed TCAMO military
communications aircraft as having the most likely correlation in time and space
with the Hum (2). Those afflicted
describe hearing a distinct, yet annoyingly penetrating, sound akin to a slowly, irregularly idling engine. Others
describe a noise like a giant bee trapped in a bottle perceiving the noise
behind the ear or head rather than inside the ear. Musically talented individuals tend to tone
match the Hum at between 30-80 Hz and state that it has pseudo-random
modulations in frequency and amplitude of between .5 and 5 Hz. The phenomenon is also described as difficult
or almost impossible to screen with standard earplugs and often worse in the
dead of night. The Hum began in the
The present
author has spent some eight years or so investigating UK Hums and has also been
in contact with US, Canadian and New Zealand Hum investigators.
Being a
subjective phenomenon doing science on the Hum has been difficult and time
consuming and one has had to rely on many anecdotal reports and one has had to
try and evolve one’s theories to satisfy all that is known or stated. What has helped, however, is that the
author’s wife has perceived the Hum since early 2004 and the author started to perceive it about
a year later. It is reckoned that
estimates of between 2-11% of the world’s population perceive the Hum and that
Hum perception maximises in middle age (2).
The present
consensus is that the main route for perception is the presence of infrasound
and low frequency acoustic sound in a highly skewed acoustic spectrum with
relatively silence above about 200Hz. In
some individuals there appears to be one or more synergetic mechanisms of perception
at work in addition to this main route which are either bio-electromagnetic or
bio-gravitational or both (6,7).
At least
for the Hum perceived in
For world Hums in general there has been shown
a recent strong geo-spatial correlation with renewable energy systems
especially wind power (11). The link
is however not thought to be simply or entirely due to direct reception of
airborne turbine noise in premises.
Indeed Hum
levels both in
It is very
rare for a Hum investigator to be able to hear Hums in premises. What is
reported on here then is perhaps almost unique. The present study reports on
acoustic spectra recorded in premises in Charlbury,
Oxfordshire wherein a Hum was actually perceived not only by the householder
but also by the environmental health officer.
The
householder was adamant that the Hum was somehow associated with electricity
even though it could be heard with the electricity supply to the building cut
off. The assumption was made on the
basis that the complainant perceived the same or similar noise outside
electricity sub-stations or underneath power-lines. Thus the environmental
officer was persuaded to make measurements on the boundary of two nearby
electricity sub-stations. The
complainant was also adamant that some of the noise may originate from an
electricity pole outside the premises, thus measurements were made under this
as well.
Experimental
Experiments
were conducted on the evening of
Results and Discussion
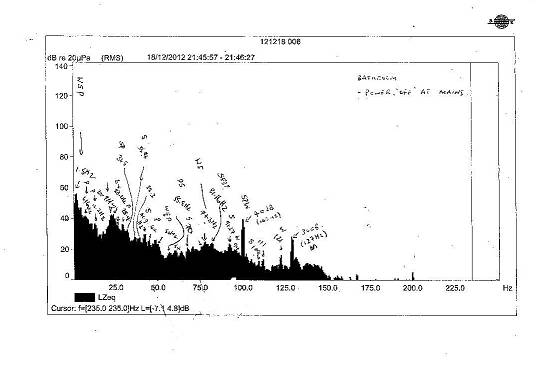
Figure 1
Figure 1
above shows the acoustic spectrum
recorded in the bathroom of the premises affected by the Hum. The most apparent feature is the highly
skewed spectrum with no frequencies present above 200 Hz. Below this there is
comb -like spectrum with major peaks 127
Hz, 100 Hz, 23
Hz, 21 Hz and approximately 1.5
Hz. There are other lesser peaks at 6,12,28.4,35.8,38.3,41.9,44,47,50,55.8,67,70,77.3,91.2 ,94,108,111 and 121
Hz. It is interesting to note that the original Bristol Hum was tone matched to
36 Hz and that is extremely close to one of the spectral components found
here.
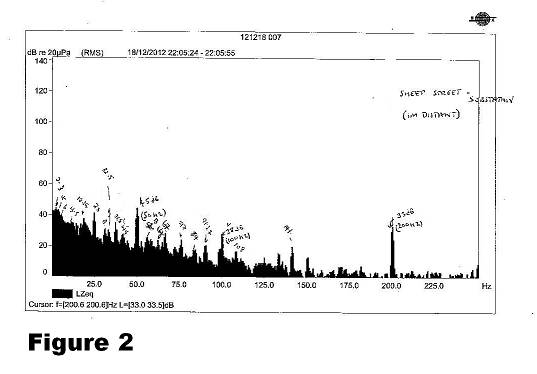
Figure 2
shows the spectrum 1 metre distant from the entrance of the nearby Sheep Street
sub-station there are a number of major, narrow tonal components extending from about 1.4 Hz to 300 Hz with
significant maxima at 1.4, 23,35, 94
and 200 Hz and other notable spikes at 12,13,31,36,47,56,60,84,117,128 and 300 Hz. Components of 31 and 36 Hz
have been mentioned elsewhere by Sergeant and by Leventhall
in relation to the Hum.
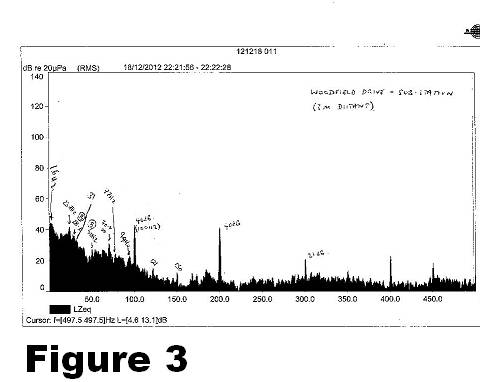
Figure 3
above shows the spectrum at the
other nearby sub-station, namely Woodfield drive. There
is tonal noise and across the entire spectrum with harmonic peaks to 450 Hz and
broad band noise below 150 Hz. The most significant tonal peaks are
as is expected of a typical substation i.e. 100 Hz and also at
200,300,400 and 450 Hz. Within the broader band section there are more distinct
signals at 1.6,23.7,28.3,50,70.4,94,121 and 150 Hz.
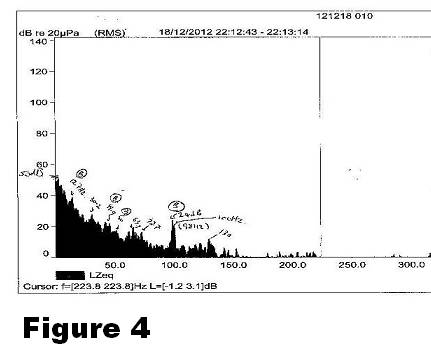
Figure 4
above shows the spectrum recorded beneath the pole adjacent to the premises.
Broadband
noise between 0-125 Hz was apparent.
Most significant peaks were at 2.3,4.6,6.7,
10,16.8,28,41.8,56,60,75,100,110,127 Hz.
What is
evident is that 80 % of the major acoustic and infrasonic frequencies present
at the premises can be provided by the two substations and also some 40% of those with lower amplitudes. Those provided by the
No feature
seems present at the premises higher in frequency than circa 128 Hz. It is of course well known that low
acoustic and seismic frequencies propagate though air and ground respectively
with least attenuation (14.15). Overall electricity external infrastructure
including the two substations and the pole would seem to be able to account for
about 70% of the entire acoustic spectrum present in the premises including
several key frequencies which have been shown to be associated with other Hums
in geographic locations significantly elsewhere, in
The most
striking single result was that the amplitude of the 100 Hz tonal component at
the premises of 40dB was the same as that only 3m away from the entrance at the
In this
particular case the author most certainly believes further investigation is
warranted. The mechanism by which the
sound, particularly the 100 Hz tonal component, arrives at the premises totally
without apparent path loss is indeed intriguing. A noise level of 40dB at night is an
unreasonable in a normally very quiet rural area and sufficient to delay sleep
onset or cause sleep disturbance (19). It may be that there is a room or room resonances
close to the offending frequency, such concepts have been described by the
author elsewhere (20). It could be that some magnetically permeable
material within or attached to the building fabric lies within the induction
field of the outside pylon and is vibrating accordingly (21). It could be that the premises are built on piezoelectric or magnetic rock through which a substantial
ground current is flowing thus inducing vibration of the premises as a whole(22). Madshus
et al 2005(23) could provide an
alternative intriguing answer to this if there is present both an airborne
acoustic wave and a related ground borne
visco-elastic Rayleigh Wave. They found that the
pressure wave interaction with the viscoelastic
Rayleigh wave in the ground may have a. significant effect on the ground
impedance and the sound and vibration propagation. This introduces an important
mechanism not covered in commonly used ground impedance models. They developed
numerical simulation models and verified against the test data. The ground
impedance does not only effect the sound pressure propagation. If either
acoustically induced ground vibration, or ground to building transmitted
vibration, is to be considered, the acousto-seismic
impedance has a dramatic effect on the level of ground vibration induced by a
given sound pressure. For a site where Rayleigh wave interaction appears at the
dominant frequencies of the sound pressure, the ground vibration may be greater
than a factor 100 (40 dB) than at a site with ground conditions not making the
interaction happen. Such might be exactly the example with, for instance an
electricity substation with ground mounted transformers. It is interesting to
note that Moir (24)
has observed that for the Hum in
What is
clear in Charlbury is that the complainant noticed a
distinct commencement of the phenomenon in July 2010. At about this time changes commenced in local
railway infrastructure, it is unclear if this would have affected either
electrical ground currents in any significant way or the propagation of ground
borne seismic signals. What is also
clear is that 2009 -2010 saw the greatest year on year increase in wind power
generation in the
Similarities between Charlbury
Hum and
To
re-iterate, the frequencies noted in the afflicted premises in Charlbury were 127
Hz, 100 Hz, 23 Hz, 21 Hz and
approximately 1.5 Hz. There are other
lesser peaks at 6,12,28.4,35.8,38.3,41.9,44,47,50,55.8,67,70,77.3,91.2 ,94,108,111 and 121 Hz, and broadband background infrasound with relative
silence above 150 Hz.
The
frequencies noted in the author’s house from several studies are: 122,100,88,65,64,60,56,50,46,33,31,28, 8.3 and 4
Hz.
What is
apparent is that there are striking similarities between the two sets of
spectra. This is quite remarkable given two very different premises in
different parts of the U K. Closest
similarities have been highlighted in yellow and those up to 2 Hz different in
grey. Clearly the electricity
infrastructure is capable of providing acoustic frequencies of 50 and 100 Hz
into people’s premises as discussed here and elsewhere and from the signals at
recorded adjacent to the two sub-stations would appear capable potentially of
providing a whole load of other frequencies in addition, which in Charlbury were: 1.4, 1.6, 4,6,12,
13, 23, 28,31,33,35, 47, 56, 60, 64,
84,100, 117,121,128,200,300,400 and 450 Hz.
The only low (infrasound) frequency not experienced in Charlbury but present in Bangor is that at 8.3 Hz thought
to be associated with the Dinrowig pumped storage
facility. Clearly the signal propagation
path is limited in that direction.
Whereas seismic signals of lower than this frequency would appear to
propagate significantly further.
In other
words virtually all the frequencies experienced some 400 km distant in the
author’s home. It is instructive to compare
the result for the
The question now arises do any of the
frequencies in the complaint’s premises not arise as a result of electricity
infrastructure? The 111 Hz peak in the
bathroom at Charlbury does seem disproportionately
high compared with that part of the spectrum at either of the substations but
it is interesting to note that the power grid in
Four out of seven of these frequencies to within 1 Hz or so, also highlighted in green have also been observed in the Bangor and Anglesey area in association with High Pressure Gas mains and Gas Pressure Reducing Stations (16). http://www.drchrisbarnes.co.uk/UTILITY.htm.
Most perplexing of all is the frequency of 56 Hz which has been recorded in association with both gas and electricity infrastructure and which has also been audio recorded in New Zealand as in association with the Hum(24).
Many of these frequencies also
correspond with or are very close to natural Earth Schumann Resonances (26) to which it is argued human brain
rhythms have also evolved (27). This
might account for why Hums are so difficult to screen out because the brain is
trying to process information from them.
There is of course also evidence that the HAARP system in
Conclusions
This study is extremely important
because the results it reveals appear to
reinforce much of the author's
previous work (29) yet the data has
been acquired by a totally independent body and by equipment other than that
normally used by the author. The
complainant states that the Hum in question is audible at other locations in Charlbury. This is
just as the hum in
It has been shown that most,
possibly all of the frequencies found in premises wherein occupants suffer from
the Hum can be potentially supplied by electricity infrastructure. An unusually high level of 100Hz audio exists
in the complainant’s premises which cannot be explained by routine acoustic
propagation. This may be explainable
because of room resonance, the presence of magneto-strictive
foundations to the premises or such material within or attached thereto and/or
the Madshus et al 2005 may be very relevant to this
and other Hums worldwide. Clearly further investigation is required. This strong 100 Hz signal exists at the
premises together with almost a comb spectrum of other narrow band signals of
varying amplitude some possibly at amplitude levels traditionally regarded as
too low to cause annoyance but this would change if they were modulating
features and these are super-imposed on a broad band infrasound
background in an acoustically skewed spectrum pretty much quiet above 200 Hz
and shown on several occasions elsewhere to be requisite for or feature of the
Hum (30,31). Due to the equipment employed it has not been
possible to tell, if for instance the 100 Hz signal was amplitude or frequency
modulated by any of the lower frequency features observed. The complainant
describes the noise as modulated in the typical sense of the Hum as described
by the majority of the afflicted. Given
that there is infrasound present both broad band and tonal in addition to the
100 Hz, this is hardly surprising. Modulation effects can occur due to non
–linearity in the ear, see Moller and Pederson 2004 (32) and this helps explain why the few
hums which have been audio recorded rarely, if ever, mirror that which a
complainant perceives.
In Britain, high pressure gas mains
often share the same land corridors as those used by overhead electricity
supply at both National Grid and DNO level (33). Due to induction common frequencies will
appear. As more and more non –linear loads and cyclo-converters
are used in the electricity industry, steel and cement industry and railways it
is hardly surprising that more and more inter-harmonic is turning
up and in turn affecting even the
acoustic vibrations of sub-station transformers. Interestingly cyclo-converters were first used in Britain in the 1970’s (34) the time the
Hum first turned up. Recently sub –harmonic groups ( likely to be more relevant for the Hum) have been shown to
be stronger than expected on low voltage circuits, see Barros 2007 (35). Precise methods of calculation accounting
for fundamental frequency drift are given by Vahedi et
al, 2013 (36). It is at
present impossible to say if, for example, the 56 Hz frequency is an
inter-harmonic or is associated with gas compressors. Also, both systems have extensive pipe and
cable runs, many thousands of kilometers around
References
1. http://en.wikipedia.org/wiki/The_Hum
2. http://www.scientificexploration.org/journal/jse_18_4_deming.pdf
3. http://www.johndawes.pwp.blueyonder.co.uk/taos.htm
4. http://www.johndawes.pwp.blueyonder.co.uk/kokomo1.pdf
5. http://news.bbc.co.uk/1/hi/8056284.stm
6. http://www.drchrisbarnes.co.uk/HUMCAVE.htm
7. http://www.drchrisbarnes.co.uk/HUM3FIELD.htm
8. http://www.drchrisbarnes.co.uk/BANGORhum.htm
9. http://www.drchrisbarnes.co.uk/UTILITY.htm
10. http://www.drchrisbarnes.co.uk/HUMHOUSE.htm
11. http://drchrisbarnes.co.uk/HUMGRIDNEW.htm
12. http://www.drchrisbarnes.co.uk/geomag.htm
13. http://www.drchrisbarnes.co.uk/HUMIMF.html
14. http://www.sfu.ca/sonic-studio/handbook/Sound_Propagation.html
15. http://en.wikipedia.org/wiki/Seismic_communication
16. http://www.sciencedirect.com/science/article/pii/S0022460X03009246
17.
Personal
communications with affected
subjects
18.
http://www.drchrisbarnes.co.uk/HUMROOM.htm
19.
www.euro.who.int/document/e92845.pdf
20. www.drchrisbarnes.co.uk/HUMROOM.htm
21. Development
near overhead lines - National Gridwww.nationalgrid.com/NR/.../Developmentnearoverheadlines.pdf
22.
http://www.drchrisbarnes.co.uk/TheHumQuestionsandAnswers.htm
23.
http://www.sciencedirect.com/science/article/pii/S0003682X04001598
Air-ground interaction in long range propagation of low frequency sound and
vibration - field tests and model verification
Madshus, C.; Lovholt,
F.; Kaynia, A.; Hole, L. R.; Attenborough, K. and Taherzadeh, S. (2005). Air-ground
interaction in long range propagation of low frequency sound and vibration -
field tests and model verification.Applied Acoustics,
66(5), pp. 553–578.
24.
http://www.speechresearch.co.nz/humspec.jpg
25. http://en.wikipedia.org/wiki/Wind_power_in_the_United_Kingdom
26.
http://www.glcoherence.org/monitoring-system/earth-rhythms.html
29.
http://www.drchrisbarnes.co.uk/HUMPUBS.htm
30.
http://www.drchrisbarnes.co.uk/Silence.htm
32.
H. Moller and C.S. Perderson,
‘Hearing at low and infrasonic frequencies’, Journal of Noise and Health 2004, 6 (23) pp37-57.
33. www.elec.uow.edu.au/iepqrc/content/papers/AUPEC/AUPEC04_6.pdf
34. Interharmonic Task Force Working Document IEEE
2001
35. J.Barros, Measurement of Sub-harmonics in
power voltages, Conference Proceedings, Power Tech 2007, IEEE, Lausanne.
36. Vahedi et al, Journal of Power
Electronics Vol 13 (1), Jan 2013.