The present author's hypothesis is thus then that the human activity which gives rise to the Hum ought to be detectable as something unusual in the frequency spectra of PC1 pulsations. Secondly, conditions for PC1 pulsations are set by the solar wind speed and reflective in various geomagnetic parameters. Thus the next question to be posed is can the Hum or at least its increased likelihood be predicted from foregoing geomagnetic parameters?
Experiment and data sources
The experimental data has been available for several years and consists of private records of the author in which his personal experience of the Hum was logged, dates, times and relative amplitude or relative distress level. This data can be compared with data from induction magnetometers around the world and with geomagnetic data available at the spaceweather website9.
There are induction magnetometers in a number of locations round the world including HAARP at Gakona, Alaska10 and at Kiruna in Sweden11 to name but two. Unfortunately archive data seem to be no longer accessible at HAARP but Kiruna continues to prove very useful. The methodology used was simply to scrutinise the Kiruna spectrography at several times and dates when the Hum was experienced very badly at the author's residence and compare them with times when there was no Hum. With regards to geomagnetic parameters the average geomagnetic field (nT) and Kp values on these same 'Hum' and 'no Hum’ days was taken from http://www.spaceweather.com/.
Results and Discussion
With several years worth of available data there is the potential for a far more in depth, but horrendously time consuming, study here but in order to get these very important general trends released into the public domain as soon as possible the data sets were limited to a dozen strong Hum days taken at random from the years 2007, 2009 and 2011 and similarly for no Hum days.
The results of the geomagnetic parameters study are shown below:
With Hum- Average
Solar Wind Speed 352 Km/sec
Without Hum – Average
Solar Wind Speed 473 Km/sec
With Hum – Average
field strength 4.3nT
Without Hum
3.09nT
The geomagnetic index
Kp had an average value of 1.0 in each case.
The author is not a space physicist by training but an intuitive explanation of the result is offered.
Presumably slower moving protons and electrons are easier for power line harmonic radiation to interact with. Presumably as the Hum is manifest as a perturbation on a magnetic field the stronger the DC component the stronger the induced ground current.
The results of the induction magnetometer study are next shown by way of a few
examples.
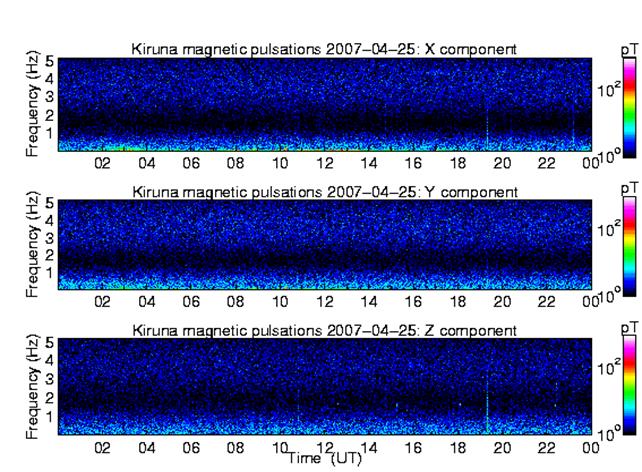
Figure 1 Kiruna induction magnetometer result for
In figure 1 the pulsations are in the form of random noise in two distinct broad bands. The lower band is centred on a bout .3Hz the upper on about 4 Hz. There is what looks like an anthropogenic signal or an earthquake shock precursor signal at about 1930 hours. There are less of these shock signals in figure 1 than in the other figures below and it is worth noting it was almost a month after this record that any significant world earthquakes took place. This record was however preceded by five significant world earthquakes earlier in April. The author has commented in the past about the Hum intensifying before earthquakes and diminishing soon afterwards. There is clearly an incredibly complex link here summed up by the work of Zotov and Gugliemi12. Others have commented too on changes in PC1 pulsations prior to earthquakes13.
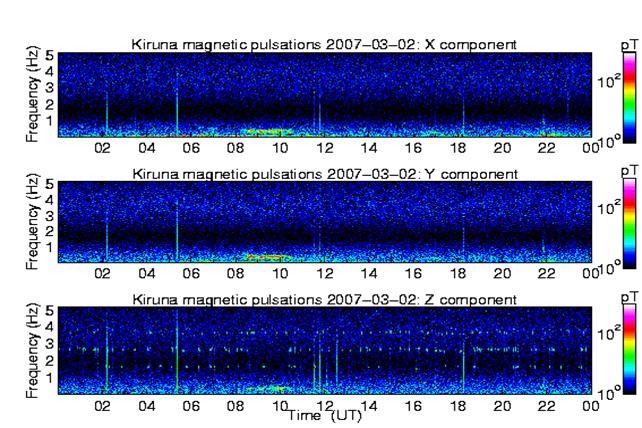
Figure 2 Kiruna spectrum
In essence the background random
pulsations in figure 2 look very similar to those in figure 1 but in the Z -component there is lots more
evidence of anthropogenic signals at discrete
frequencies of 1.7,2,5 and 4 Hz . Other narrow time slot or short shock
wideband signal are also seen cutting across all three orthogonal filed
directions. The large
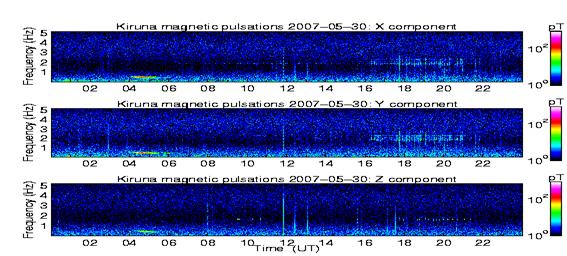
Figure 3 Kiruna 30th May 2007 Daytime Hum
Here the frequency of 1.7 Hz is
still present. There is a frequency of 2 Hz present in the X and Y directions
together with bursts of simultaneous comb spectra. There are a few earthquake shock precursors.
A magnitude 6.4 earthquake took place in
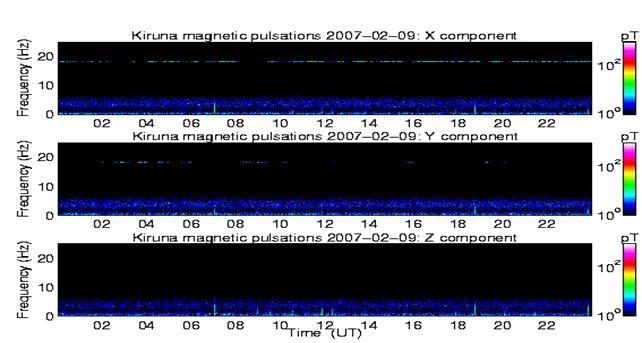
Figure 4 Kiruna
Here there are weak at 3-4 Hz in
all three directions and an almost continuous signal at about 17Hz in the X and
Y component. There are also earthquake shock pre-cursors. The
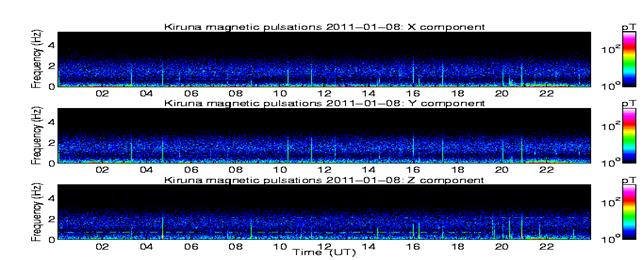
Figure 5 Kiruna 8th January 2011 Intense Hum
Here there is an almost continuous dash like signal at about .6 Hz in the Z component and weak bursts of signal at about 2 Hz in the X and Y components. There are also short shock earthquake pre-cursors. In that respect three significant earthquakes occurred around the world between January 9th and 19th 2011.
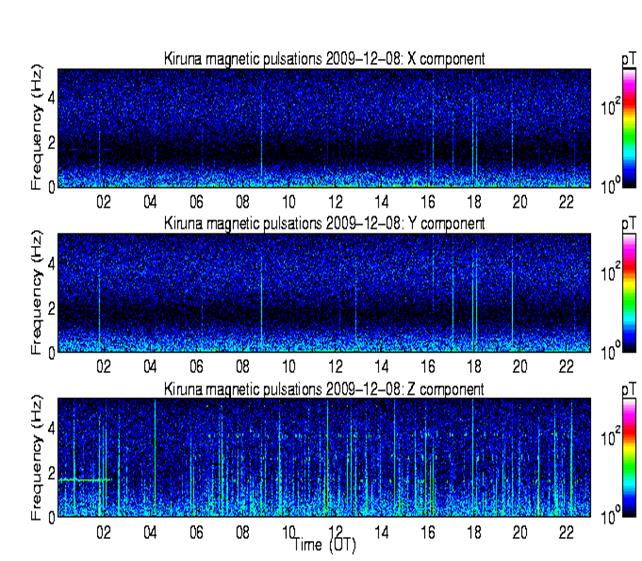
Figure 6 Intense Hum
Here the z direction has a
quasi-continuous signal at 1.7 Hz and weaker bursts at 3, 4 and 5 Hz. There are also a large amount of narrow time
broad frequency bursts and comb spectra bursts and earthquake shock pre-cursors
common to all three directions. In this respect a significant earthquake
occurred in
In essence a significant range of features has been seen in figures 2-6 all of which would seem to be associated in some way with the Hum. The frequencies manifests in the PC1 pulsation band certainty seem to fit with anecdotally described modulation frequencies for the Hum. It is possible that the short bursts of frequencies as indicated by the dots and dash patterns in the spectra actually occur more often than recorded, the limitation being the response time of the equipment or that for part of the time they are lost in background noise. In this respect the HAARP magnetometer appears slightly more sensitive than the one at Kiruna. This can be seen by making a direct comparison as follows;
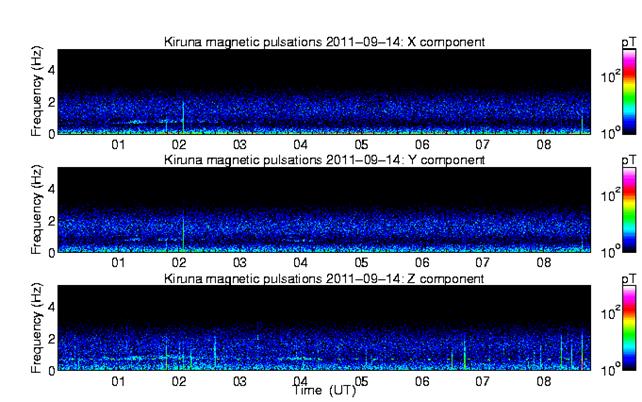
Figure 7 Kiruna magnetometer Man made influence seen as dashes approximately 0.6 Hz in Z -component
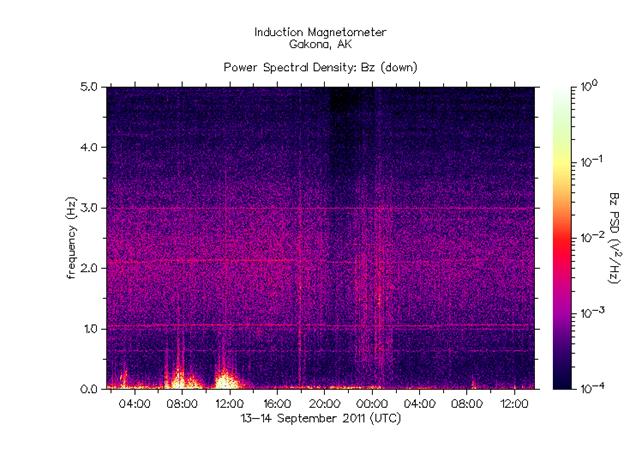
Figure 8 HAARP magnetometer
The same feature at 0.6 Hz can be seen but features at 1, 1.1, 2.2 and 3 Hz can also bee seen.
Due to the nature of ULF
pulsation it will of course not be constant across all corners of the globe14.
From the author's personal experience the more complex the frequency pattern or the more pronounced the feature, the more intense the Hum as seemed. Generally speaking most of the times these type of features mainly appear in the Z- components but when they also appear in X or Y or both the Hum is even more intense.
Another question is how such a
richness of frequency component arises.
Due to the high non- linearity of the geomagnetic interaction itself
much sub-harmonic generation is possible so these frequencies could,
potentially all be higher order sub harmonics of 50 and 60 Hz or of the 10
Hz difference between them. It is not unreasonable to suggest this as a
possibility although no one else has commented directly upon it. For instance
the PC1 production process itself is known to be non-linear15 and
artificial PC1 pulsations have been produced at HAARP by employing ULF
modulation frequencies16, 17. Such ideas could also account for the
one time observation of the signal at 17 Hz, figure 4, which could conceivably
be the third sub-harmonic of the European power grid frequency or alternatively
be associated with railways18.
PC1 pulsation frequencies are not just influenced electromagnetically,
there has been shown to be an influence of acoustic signals as well19. Possibly thus earthbound infra sound
sources like wind turbines could influence the Hum. This would be another route
for them to perturb power systems via ground induced currents from space! Since when PLHR produces
As stated above, artificial PC1 signals in the 1-3 Hz range can be made be ionospheric heaters like HAARP16,17 and EISCAT21 but cannot usually be sustained for long periods. Since the Hum can last for extended periods of twelve hours or so and pre-dates ionopsheric heating the power grid hypothesis is more attractive.
Completing the story is how
humans perceive these modified PC1 pulsations. The author's view is they are
received as ground currents, which subsequently can re-interact and modulate existing power
system ground currents and frequencies (usually present due to phase imbalance)
and from there produce noise and vibration by electro-seismic coupling. Pc1
interactions are also proposed to directly affect the propagation and re-radiation
of PLHR to ground as
The observations made here won’t stop the Hum but at least they can help those afflicted predict to some extent periods of quiet or periods of quiet or periods of disturbance. The human entity is intimately attuned to mother earth whether we like it or not. Geomagnetic activity has shaped our past, even our politics and revolutions22 now modulated by mankind produces the Hum, who knows what is next?
Conclusions
- A link between the Hum and anomalous features in
PC1 pulsation spectra between 0-6
Hz and once to 17 Hz has been established
- This is in strong support of the Hum been related to
interactions between world power systems and so called power line harmonic
radiation as previously suggested
by the author
- Ionospheric heaters can also produce PC1
anomalies like the ones seen with
the Hum
- Maybe outbound infra sound and acoustic sources can
influence PC1
- When PC1 pulsation spectra are clear of bursts,
spikes, comb spectra and dot and dash like features, there is no observed Hum and
- Certain sets of geomagnetic features seem to indicate
the Hum, it seems to prefer a slow solar wind speed average 352 Km/sec and
an average field strength of 4.3nT.
- These observations won’t stop the Hum but at least
they can help those afflicted predict to some extent periods of quiet or
periods of quiet or periods of disturbance.
References
- ' The Hum, a feature of infrastructure, a
radical new explanation based on World power grid interactions as to why
it was reported in the UK some twenty years before the US. Derived
from spectral analysis of measured ground currents,
- Reception of ELF SIGNALS at Antipodal
Distances, Fraser-Smith, http://www-ee.stanford.edu/~acfs/82Hz.pdf
- The natural background levels of 50/60 Hz radio
noise, Fraser-Smith, A.C.; Bowen, M.M.; http://ieeexplore.ieee.org/xpl/freeabs_all.jsp?arnumber=155849
- Generation mechanism of power line harmonic
radiation, Kostrov, Alexander;
Gushchin, Mikhail;
Korobkov, Sergei,
38th COSPAR Scientific
Assembly. Held 18-15 July 2010, in
- Natural and
man-made terrestrial electromagnetic noise: an outlook, Bianchi and
Meloni, Annals of Geophysics, 3 / 50 (2007), http://www.earth-prints.org/handle/2122/3674
- Geoelectric
Fields and Geomagnetically Induced Currents in the United Kingdom, McKay,
Allan John, University of Edinburgh; College of Science and
Engineering; School of GeoScience, http://www.era-test.lib.ed.ac.uk/handle/123456789/639
- The human impact on the Pc1 wave activity, A. Guglielmi,
O. Zotov, Journal of
Atmospheric and Solar-Terrestrial Physics, Volume
69, Issue 14, October 2007, Pages 1753-1758.
- Effects of man on geomagnetic activity and
pulsations, A.C. Fraser-Smith, Advances in
Space Research, Volume
1, Issue 2, 1981, Pages 455-466.
- http://www.spaceweather.com/
- http://maestro.haarp.alaska.edu/cgi-bin/scmag/disp-scmag.cgi
- http://www.irf.se/maggraphs/puls.php
- http://scholar.googleusercontent.com/scholar?q=cache:qJtUbk2M3WgJ:scholar.google.com/+ACOUSTIC+INFLUENCE+ON+PC1+PULSATIONS&hl=en&as_sdt=0,5
- http://www.sciencedirect.com/science/article/pii/003192019390037A
- Multistation correlation of ULF pulsation spectra
associated with sudden impulses, J. Kangas, A. Aikio,
J.V. Olson, Planetary and
Space Science, Volume
34, Issue 6, June 1986, Pages 543-553 , http://www.sciencedirect.com/science/article/pii/0032063386900929
- Fine structure of Pc 1 pulsations. I - Experimental
evidence, WEHRLIN, N | GENDRIN, R | ROUX, A | WELTI, R, Journal of
Geophysical Research. Vol. 78, pp. 763-768.
- First Observations of Artificially-Generated ULF
Magnetic Pulsations at HAARP, Parent, A.;
Mann, I. R.;
Kosch, M.;
McCarrick, M.;
Pedersen, T.;
Hayashi, K.,
American Geophysical
Union, Spring Meeting 2007, abstract #SA53C-02, http://adsabs.harvard.edu/abs/2007AGUSMSA53C..02P
- Artificial Generation of ULF Waves in the Pc1 Range
Using the HAARP Heater, Chang, C.;
Wallace, T.;
Milikh, G.;
Papadopoulos, D.,
American Geophysical Union, Spring Meeting 2007, abstract #SA51A-03, http://adsabs.harvard.edu/abs/2007AGUSMSA51A..03C
- ELF magnetospheric lines observed by DEMETER, M. Parrot F. Nemec O. Santolik J. J. Berthelier, Annales
Geophysicae 23, 10 (2005) 3301-3311, http://hal-insu.archives-ouvertes.fr/hal-00330062/
- Correlation between Pc1 electromagnetic activity
and earthquakes, A. V. Guglielmi
and O. D. Zotov, Izvestiya Physics of the Solid
Earth , Volume 46, Number 6,
486-492, DOI: 10.1134/S1069351310060030
- A theory of PLHR emissions to explain the weekly
variation of ELF data observed by a low-altitude satellite, http://cat.inist.fr/?aModele=afficheN&cpsidt=4986567
- Generation of artificial magnetic pulsations in
the Pc1 frequency range by periodic heating of the Earth’s ionosphere:
indications of ionospheric Alfvén resonator effects, T. Bösinger, T. Pashin,
A. Kero, P. Pollar, P. Belyaev, M. Rietveld,
T. Turunen, J. Kangas, Journal of
Atmospheric and Solar-Terrestrial Physics, Volume
62, Issue 4, 1 March 2000, Pages 277-297, http://www.sciencedirect.com/science/article/pii/S136468269900125X
- Heliogeophysical
factors as possible triggers of suicide terroristic acts, Pavel Grigoryev1, Vsevolod Rozanov3, Alexander Vaiserman2, Boris Vladimirskiy, Health 1(4),
294-297 (2009).