Presenting a utility by utility acoustic spectral study employing a computer based spectrum analysis program with waterfall output, the Bangor and surrounding area’s Hum is it electric, gas or both? By Dr Chris Barnes Bangor Scientific Consultants
scienceconsultants@yahoo.co.uk
Abstract
An
acoustic study of Bangor and LlanfairPG is made in the frequency range 0-313 Hz
approximately considering the different utilities as sources of sound for the
phenomenon know as the Hum. Essentially the hypothesis of Vasudevan and Gordon,
Institute of Sound and Vibration Research University of Southampton) is
confirmed with regard to the presence of the Hum in the context of a highly
skewed acoustic spectrum but not necessarily within the context of signal
origin. It is shown that the Hum generally requires a substantial infra sound
component, some sort of narrow band acoustic signal(s) of constant frequency
within the the range 30 -80 Hz and minimal or zero acoustic sound above that
frequency range. Signals from both the power grid and gas mains can produce Hum
most of the time in parts of the village of LlanfairPG whereas at the author's
house the Hum comes and goes according to propagation of infra sound and
seismic sound from larger distances away particularly when there is instability
in a particular 400KV circuit in the electricity grid giving rise to
sub-harmonic and inter-harmonic acoustic noise.
Introduction
The Hum is now a widely reported phenomenon in Britain having grown extensively since the 1970’s. People who hear or perceive the Hum is often labelled Hummers and it would seem that in one mode of perception of the phenomenon they are more sensitive than average to low frequency noise. This does not rule out that there could be other modes of signal perception in some sensitive individuals not related to low frequency noise and these have been discussed by the present author elsewhere( refs). The Hum is sometimes described as the noise of an idling engine or throbbing sound. These are also described as the effects of infrasound (Poulsen and Mortensen Working Report 1 to Danish Environmental Protection Agency 2002).
The present author has too
established that infrasound and low frequency sound are associated with the Hum
(refs). It seems it is also the case when two prevalent low frequencies
which are not infrasound they can beat together with an infrasonic room
resonance to produce Hum like effects
(res). It has been shown experimentally that people who
perceive a throbbing nocturnal disturbance, i.e. what the present author would
describe as the Hum find a particular type of acoustic spectrum most annoying.
Such a spectrum is described by researchers other than the present author as a broad band spectrum whose amplitude lies close to the threshold of human hearing but skewed or unbalanced to the extent where the major stimulus lies in the frequency range 20-100 Hz (Vasudevan and Gordon, Institute of Sound and Vibration Research University of Southampton) and is thought to arise from distant industrial sources. The present author has already commented on the sound for the Hum at his own residence arising via different acoustic channels, some locally and some more distant allowing only for propagation at night (refs) and possible coherent source effects (ref) and the frequency range described above is exactly where one would expect to find anthropogenic signals from utility services as well as certain industrial processess. So perhaps we should begin by looking closer to home for some sources of the Hum. The author’s previous paper describes a special case of the Hum when there is instability in the power grid (ref) although seismic signals from motor generator sets at UK and International Hydroelectric power plants will always be propagating in the ground ( Hjortenberg and Risbo, Geophysical Journal of the Royal Astronomical Society 42(2) pp 547-554 August 1975); on the other hand when the Hum first commenced in Britain traffic and gas mains took the blame (Fox 1992) and (an anonymous BBC sound recordist writing in The Telegraph 22nd June 2005). Because the Hum appears to come and go at some locations this may have given rise to the original misconceptions that it is somehow an unexplainable or even 'paranormal' phenomenon but it must remembered that the original recording equipment used in the famous US Taos study was not as sophisticated as that available today.
Measuring techniques.
When seeking infrasonic and
acoustic signals with amplitudes close to the threshold of human hearing
traditional sound recording equipment has serious limitations. Assessment by
tuneable, narrowband, equipment is very laborious. Many environmental Health
Departments have only broad band equipment and only traditionally rated decibel
meters not meant to cover audio signals below 63 Hz. Dedicated
spectrum analysers are very expensive instruments but an elegant way of making
measurements is to use a laptop computer running a spectral analysis program.
Of course calibration wont be perfect but one can calibrate against a loud
broad band source such as moving ‘in car’ noise, bearing in mind that the
roll-off of the laptop electret microphone is about 10dB per octave below
100Hz. The advantage of using a waterfall display is the incredible
sensitivity and ability to distinguish weak signals from noise over time and
adjust discrimination to any part of the dynamic range by tuning the colour
spectrum and taking advantage of the computer’s large colour
palette.
Experimental
In the author’s previous publication it was concluded that there is a very strong association of the Bangor Hum with the electricity grid. This conclusion ties in with previous conclusions associating it with the Dinorwig hydro-scheme. However, frequency- pairs have additionally been measured at the author’s residence which create Hum or Hum like effects in the absence of instability in the grid or in the absences of airborne or ground borne infrasound therefrom. Thus it was decided to conduct a comprehensive survey of all the underground utilities in order to establish which conducted which frequencies, if any, as vibrations into the residence. Another residence affected by the Hum on Anglesey was also tested.
Acoustic spectra from the
electricity grid were first obtained and recorded. Then
acoustic spectra from over a high pressure gas main close to a regulator
station was obtained and recorded. Acoustic spectra next to a water
treatment works and a small reservoir were also obtained and recorded. A
telephone enquiry to the water utility company confirmed that both properties
were on gravity fed water supply and therefore ought not to be receiving
pumping noise. For simplicity, the aforesaid will be regarded as the source
spectra. Low frequency vibrations as seismic signals or airborne
infrasound can travel large distances unimpeded under appropriate
conditions. The job next was to search for signs of the source spectra at
locations afflicted by the Hum. The aim is also to build up a database of
frequencies which could be potentially useful in Hum investigations elsewhere
in the UK.
Spectra were then obtained
outside the author’s residence immediately over the routes of the gas and water
pipes. The routes of the electricity cables were unknown.
Similar spectra were
obtained at the house in Anglesey. For simplicity these will be referred to as
the ‘sink spectra’.
Results and Discussion
The printouts of the
waterfalls for various source spectra are presented below. The results are
fairly self explanatory; each frame has a vertical axis covering a time slot of
…. and a horizontal axis covering a
frequency of 0-312 Hz unless otherwise stated. The signal amplitudes are shown
on the inset colour spectrum key.
ABOVE : Acoustic Calibration Car engine noise and vibration with dB meter and allowance for electret microphone. -55 on scale ( peak white) on scale at 10Hz = 90 dBA and at 100 Hz = 80dbA approx.
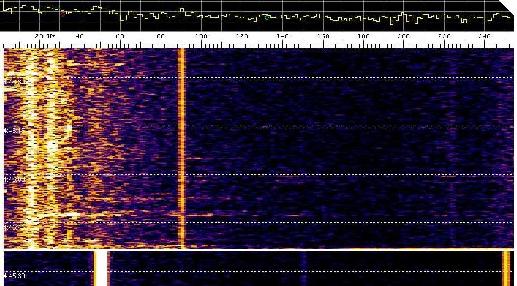
Figure 1 ; Llanllechid 400 KV single circuit, Hum perceived
strongly
Figure 1 shows the acoustic
source signal for electricity (also shown magnetic signal).
The predominant frequencies
are 16.7 and 25 Hz also present 33 Hz and broad noise
40-60Hz. Peak sound levels approx 85 dBA. In the magnetic spectrum below it is much cleaner with a weak even harmonic a third harmonic about 30dB down and a little ELF noise.
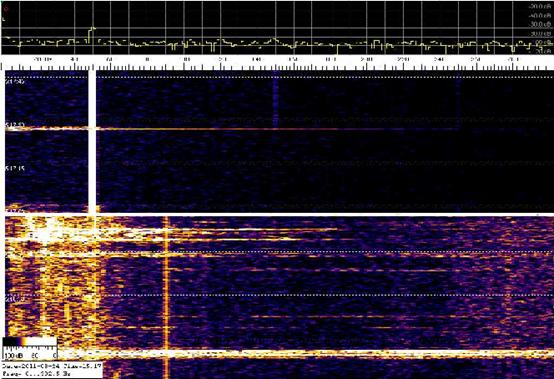
Figure 2
Electricity source signal Anglesey 400 KV double circuit. Hum perceived strongly
The result for the Anglesey double circuit figures 2 is similar to figure 1 except there is a wide band of infra sound at 5-12 Hz there are also unexplained signals at 23,36,56 and 112 Hz. Peak sound levels 78dB(A).
Figure 3; Acoustic source signal Llanfair PG High Pressure Gas Main,
with traffic noise, Hum strongly perceived.

Frequency components of noise 0-60 Hz approx (78dB(A), strong narrow band intermittent components at 45,50,68 and in particular 73 Hz circa 90dB(A) .
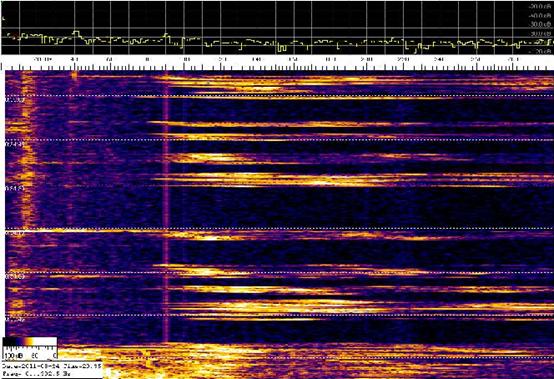
Figure 4 : Above acoustic source Electricity
sub station Reichel Bangor, Hum not perceived.
A
Frequency component of 16.7 Hz third maims sub harmonic is present at about 70dB(A) and some wide band audio bursts in the range
80-300Hz .
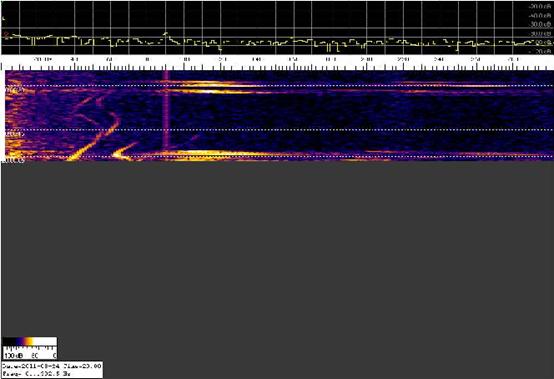 Figure 5: Acoustic source; water
treatment plant (also near Dinorwig hydro-plant) Hum perceived.
Figure 5: Acoustic source; water
treatment plant (also near Dinorwig hydro-plant) Hum perceived.
A broad infra sound
averaging around 70dB(A) at 8.5 Hz is present, together with very weak
components at 16.7 and 25 Hz at about 55dB(A), even so the Hum could be clearly
heard at this location. It is thought this is because of a form of
coherence. There was an 11KV circuit nearby.
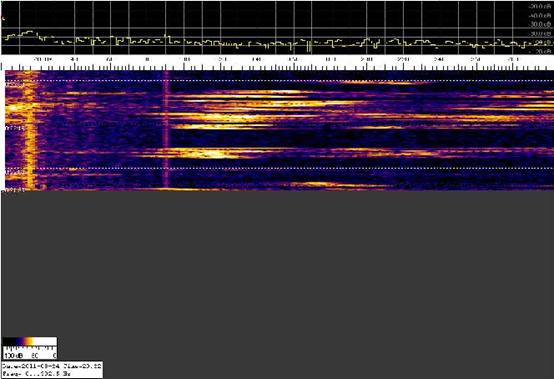 Figure 6; Acoustic Source small water
reservoir in Bangor Hum not perceived.
Figure 6; Acoustic Source small water
reservoir in Bangor Hum not perceived.
This yields a single fairly broad- band infrasound source of 14 Hz, possibly due to water flow or pumping. Although most properties in Bangor are gravity fed it is known the University a large consumer of mains water in Bangor employs its own pumping to tower blocks ( personal communication from a Welsh Water Inspector). It is further known that old steel and cast iron water mains can conduct sound and vibrations for relatively long distances (ref).
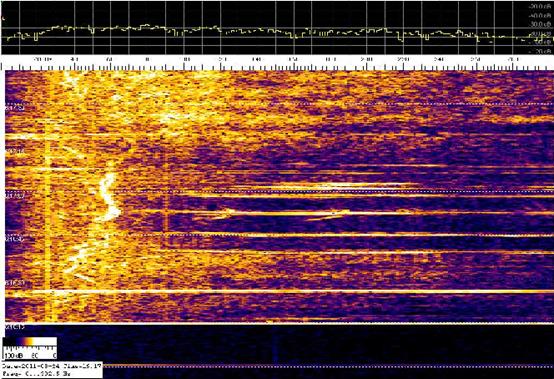 Figure 8 Bangor Sink Mains water signal 1617 GMT Hum not
perceived, loud traffic noise.
Figure 8 Bangor Sink Mains water signal 1617 GMT Hum not
perceived, loud traffic noise.
The signal is very noisy
due to passing traffic. Frequencies of circa 26, 44 and 56 Hz are noted.
Since the water is gravity fed and since water and gas pipes run in close
proximity it is possible these signals are not due to water supply.
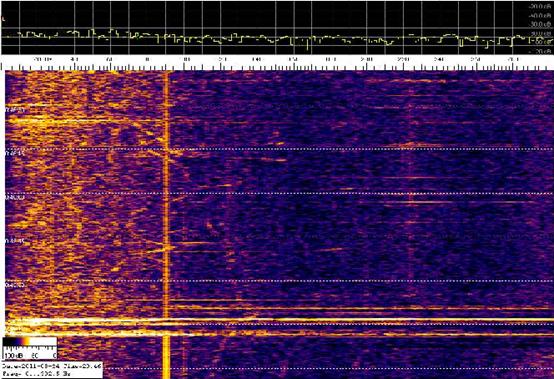 Figure 9; Bangor Sink
Mains Water 2046 GMT ( Author's residence) Hum not
perceived wind and traffic noise.
Figure 9; Bangor Sink
Mains Water 2046 GMT ( Author's residence) Hum not
perceived wind and traffic noise.
In
Figure 9, a similar group of frequencies to
those present earlier in the day was present but there was in addition more
infra sound and less vehicle noise.
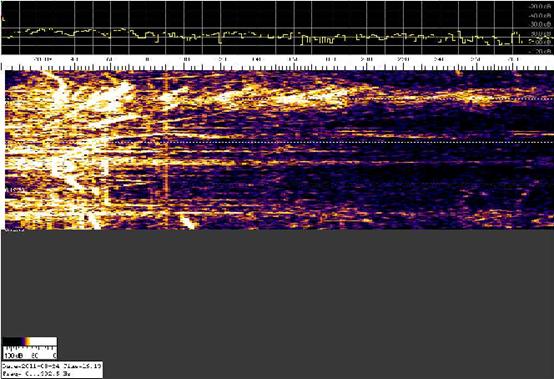 Figure 10 Bangor Sink Mains Gas (
Author's residence)
Figure 10 Bangor Sink Mains Gas (
Author's residence)
In figure 10 frequencies of 14,24,56,71,81 and 112 Hz are noted. The peak is at
56 Hz and about 85 dBA. Three of these frequencies
namely 24,56 and 112 Hz are identical with the ones recorded at the High
Pressure gas main crossing point in Llanfair PG. The signals are perhaps
somewhat surprisingly at higher amplitude but
there are two gas pressure reducing stations located nearby. There was no
perception of hums.
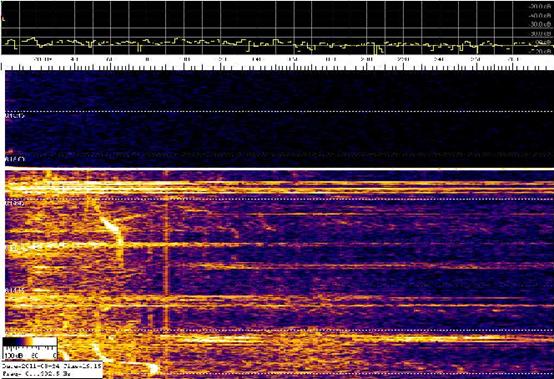 Figure 11; Bangor sink
mains gas including magnetic spectra.
Figure 11; Bangor sink
mains gas including magnetic spectra.
The
magnetic spectrum of the gas main is clean indicating no mains electricity
circulating ground currents or the like. If these acoustic frequencies were
propagated into the property with this amplitude they would be expected to
cause annoyance. No hums were perceived loud traffic noise was present.
Figure 12 ; Llanfair PG sink mains water
In figure 12 there is seen
a strong signal at 16.7 Hz and noise between 38-50Hz. Since the water is
gravity fed it is tempting to ascribe the 16.7 Hz signal to acoustic noise at
the mains third sub –harmonic. Unlike the author’s address this address
often suffers from the Hum in daytime. Two cast iron water mains run under the
property, one to a neighbouring property some distance away. It is possible
there are ground induced currents flowing on them?
Figure 13 Llanfair PG mains gas sink.
In figure 13 a whole
multitude of frequencies is noted averaging about 60 dBA. Frequencies of 6,12,20,28,50,56,68,73,80,84,and
87 Hz are noted! Frequencies of 50, and 68 Hz and 73 Hz are in common with
those observed at the high-pressure gas main.
Figure 14; Sink Llanfair PG in house
In the affected house at
Llanfair PG there was a hug amount infrasonic noise together with a wide
heavily skewed band of acoustic frequencies with virtual quiet above 160 Hz. An
average amplitude of some 80dB(A) with narrow band
signals at 45,50 and 73 Hz. These frequencies had also been observed at a gas
pipeline crossing and pressure regulating equipment some 800 m away from the
residence. To the author it is hardly surprising that this property experiences
the Hum very often. A magnetic magnetic spectrum ( not
shown here) also shows some 50 Hz and some ELF noise. Switching off
the mains electricity in the house eliminate the strong 100 Hz signal coming
from the gas boiler but only slightly reduced perception of the Hum. It would
seem there are sufficient components of frequency brought into the property by
ground borne vibration to be pre-requisite for the Hum without the need to wait
for night-time infra sound propagation.
On
the other hand the author's house experiences the Hum at different times,
mainly but not exclusively at night, see figure 15 onwards.
Figure 15 Acoustic
sink author's house 22 AUG 0001
gmt
In
figure 15 above frequencies of 7,16.7,25,33.3,36,45
and 100 Hz at up to 70 dB(A) (note different scale calibration) can
be seen. Only the frequency of 36 Hz can be definitely assigned to the
gas grid, the rest are sub -harmonic and
harmonic components from the electricity grid. Here the Hum was only weakly
perceived. Note the wideband noise above about 250 Hz. It would seem the more
noise there is here the less chance there is of hearing the Hum. By August 24th
the Hum had become almost unbearable, see figure 16.
Figure 16 Magnetic and
acoustic spectrum at sink author's residence 24th Aug 2011 0640 gmt
There
is a broad swathe of infra sound covering 2-35 Hz also signals at 45 and 56 Hz.
The magnetic signal at 50 Hz is quite clean but there is some evidence of ELF
noise. Here the Hum was perceived as being much, much stronger note there
is much less noise in the 250-300 Hz part of the spectrum.
This may be contrasted with an occasion in the morning of 22nd August at 0925 GMT when the Hum had died away, see figure 17.
Figure 17
One can see that although quite intense infra sound at 6,12,16,7 and 19 Hz remains all the higher acoustic frequencies at 25,33.3, 36 and 45 Hz have died out. As stated previously by the author in his personal experience Hum perception requires both. The frequency unstable source around 40 Hz is due to a passing vehicle. The signal at 90 Hz is the HDD artefact. There are also some weak narrow band acoustic sources present higher up the frequency scale. It would seem these together with frequency varying traffic noise also help nullify the Hum.
A major difference between the two sites, namely Bangor and LlanafairPG, is proximity to the 400 KV power grid. The author's residence is some 8 Km distant where as the residence in Llanfair PG is only about 0.6 Km distant. The hypothesis is that in Bangor airborne acoustic sound from the power grid only propagates well at night and on most days fades out in the morning. Whereas in Llanfair PG acoustic sound from both the gas and power grids can arrive more often.
It should be stressed that, at least in part, the Bangor Hum seems to be caused by intermittently propagating sub-harmonic acoustic components from an unstable section of the power grid and sometimes the omnipresent ground vibrations of the other utility services. In LlalanfairPG signals from all the utilities are more or less omnipresent and so is the Hum where a very definite frequency of 73 Hz has been identified with the high pressure gas main. In whatever case, the best one can do is to investigate a maximised signal from the other utilities and see if any hums can be perceived. Figure 18 shows the signal from a gas pressure reducing station in Bangor fairly early in the day and mainly in the absence of traffic.
Figure 18
Frequencies
of 8.5,24,31,36,50,56,71,78 and 83 Hz are present. Though some of these
Frequencies are similar to those of the electricity grid they are not the same
and they are more ideally matched to those recorded over the HP gas main in
Anglesey. At this juncture and before the passing car arrived the
phenomenon was clearly perceivable.
To
further test the hypothesis it was decided to go
back in the house and search for the Hum in various rooms. It was present but
varied in amplitude more than during the night.
It
was strongest in the downstairs toilet suggesting a ground borne phenomenon. It
was weak in the master bedroom where it has been perceived strongly during the
night. Figure 19 shows the acoustic spectrum from parts of the
master bedroom .
Figure 19 Weak Sink, master
bedroom
The
only infra sound present was approximately 19 Hz and the only well defined
acoustic Frequencies were at 33.3 and 50 Hz. This is believed to be one of the hums
due to electricity grid. Also the Hum is probably not well perceived here
because there was considerable other noise in the the higher frequency part of
the spectrum.
This
should be contrasted with the hums in the downstairs toilet which
was perceived by the author as strong see figure 20 below
Figure 20
Although
the infra sound is maybe up to 5dB louder the main differences are in the
complexity of Frequencies present. Present are 14,24,25,36,45
and 50 Hz. Most of which with the exception of 14 Hz have been found to be
associated with the HP gas grid. Note the higher frequency part of
the spectrum has also considerably less noise.
The frequency of 14 Hz has been found outside a water reservoir and is assumed to be associated with water pumping in the city of Bangor, possibly private pumping by the University. It is the only frequency in the study not to be found in the Anglesey part of the study. How much it contributes to the Bangor hums is uncertain.
Conclusions
1.
Hums can be brought about by low frequency sound preferably with
continuous or intermittent discrete frequencies in between 20 -80 Hz in the
presence of infra sound.
2.
Hums can be at locations where all frequencies are ground borne
3.
Hums which are intermittent and predominate at night-time are
usually at locations where some frequencies are airborne
4. Hums in the Bangor and Anglesey area are very likely caused by either the electricity grid behaving badly and/or the High Pressure gas grid. The relevance of the 14 Hz water mains signal remains unknown it is only found in Bangor within this study. The gas grid is capable of generating very similar frequencies to those obtained with mains sub harmonics but also generates frequencies around 56 and 73 Hz not seen underneath power grid circuits. It is very interesting to note that Tom Moir recorded a frequency of 56 Hz as being associated with the North Shore New Zealand Hum. It is believed NZ has similar methods of Natural Gas distribution to the UK
5. A strong infra sound signal at 14 Hz has been found in Bangor which is not duplicated in LlanfairPG
6.
The simplest set of conditions under which t he hums was heard during
the study was with infra sound of 8.5 Hz and 16.7 Hz and
acoustic sound of 25 Hz, there is possibly special coherence at work if the 8.5
Hz arises from a synchronous machine and the other Frequencies are mains
sub-harmonics.
7. The findings of Southampton University in relation to a skewed spectrum have been corroborated but signals can either come from afar or close by.
8.
These findings may help generate more than one solution for those
afflicted by hums.