Could changes in our pub licensing and pub smoking rules have altered cancer rates first up and then down? By Dr Chris Barnes, Bangor Scientific and Educational Consultants e-mail doctor.barnes@univ.bangor.ac.uk Released without full reference list 24th December 2013.
Dr Barnes Homepage http://www.drchrisbarnes.co.uk
Abstract
Cancer incidence rates in the UK are briefly discussed in terms of Chernobyl and in terms of RF radiation as a promoter. Although Lauer has recently shown RF radiation to cause transient blips in cancer rates, Barnes has shown that larger cumulative RF effects are probably due to the effects of lowered melatonin due to its sleep disrupting effects on the field sensitive pineal gland. Such melatonin reduction is also caused by night light and night noise, both of which increased with increases in the UK Pub Licensing hours in 2001and 2005 respectively. The hypothesis that this would strongly impact UK short latency cancers is strongly supported here. On the positive side the new tobacco rules for pubs and other public places from 2007 is also seen to reduce incidence rates after their corresponding minimum latency periods. Malignant melanoma has been previously shown by Barnes using a world geographic meta-analysis method to have least correlation with melatonin (night light) and this is borne out by there being a significant increase in melanoma prior to the changes in the licensing laws and no significant change in the slope of the trend line after the changes in licensing hours for this cancer alone.
Introduction
Most kinds of cancer incidence rates with the exception of lung cancer and stomach cancer have been rising in Britain for the past few decades. The Chernobyl accident in 1986 has partly contributed to this (1). Roadside and other pollution are also partly responsible (2). More recently some have shown associations between RF (radio frequency ) radiation as a promoter and cancer rates(3). This has been widely disputed because although there were hypothetical reasons, none had been sufficiently proven. Very recently indeed, Lauer 2013 (4) has developed theory connecting RF and cancer, T-cells and the immune system which insofar as it predicts only transient ‘blips’ in cancer rates upon the commencement of a new piece of RF technology and further insofar as it predicts that such ‘blips’ could be increases or decreases depending on modulation type has been independently tested and partly verified by Barnes 2013 (5) using data from several countries.
Barnes (5) found that in the US cancer rates have essentially saturated with the exception of Thyroid cancer, however, in the UK most cancer rates are still showing increasing trends over time. Further in the UK, Lauer’s predicted ‘blips’ were not set against a flat or saturated background but instead were superimposed on a positive gradient. Barnes suggested that the US /UK differences might be because the US has already shown complete saturation in use of RF technologies, whereas the UK has a little further to go. Further Barnes has suggested that in this ‘RF expansion phase’ the most significant effect is not the Lauer (4) effect but is instead due diminished serum melatonin in the populous at large due to sleep disturbance from mobile phone base stations due to the field sensitivity of the pineal gland. Barnes (6,7) has recently provided valuable epidemiological support for the importance of melatonin by the use of geographic mapping meta-analysis. Also the fact that night shift workers are known to have significantly higher cancer rates (8) which is in further support of Barnes.
Further via its additional interaction mechanisms such as bio-imprinting (9,10) , RF is also a real additional hazard to people with certain genotypes especially P53 problems and living at very specific distances from transmitter antennas (9,11).
The question arises do other mechanisms of sleep disturbance besides light at night, RF radiation and shift work reduce serum melatonin levels and hence increase cancer rates. Night noise and low frequency night noise are also, for example, known to do the same (7,12).
Hypothesis Part One
UK licensing laws began to change in 2000 initially to 11pm opening with midnight not being unusual on Fridays and Saturdays and with nightclubs often being licensed until 2 or 3 am on these days and by 2005 ‘all night’ drinking was implemented. Increased anthropogenic activity at night due to these changes will be expected to cause increased night light and noise and thus reduced serum melatonin, hence increased cancer incidence in an affected cross-section of the community. Hence these changes ought also to be reflected in the national cancer rate and ought to stand out somehow after a delay corresponding with the minimum latency period for each cancer concerned. Trends against time are available, for example, from the statistics branch of ‘Cancer Research UK’.
Hypothesis Part Two
From July 2007 smoking was banned in Public Houses. Besides Lung cancer, smoking also increases the risk of over a dozen other cancers including cancers of the mouth, larynx , pharynx , nose and sinuses, oesophagus , liver, pancreas, stomach, kidney, bladder, cervix and bowel, as well as one type of ovarian cancer and some types of leukaemia. There is also some evidence that smoking could increase the risk of breast cancer. Hence stopping or reducing smoking ought to counter these risks.
Thus this study will also seek to see if any decreasing step functions are seen in cancer trends associated with any of the above cancers as a result of the pub smoking ban.
Data Sets and Experimental
All the data sets are obtained from the Cancer Research UK website under ‘types of cancers’ trends over time section. The latency periods used are the shortest observed for each specific cancer. It has not been possible to consider effects on all types of cancer for some the latency periods are simply too long. The 2005 date is particularly useful since it does not correspond with any other known anthropogenic change, such as for instance changes in the background RF environment.
|
Cancer |
Common Texts |
9.11 minimum |
This study |
Texts SD |
Study SD |
|
|
yrs |
yrs |
yrs |
|
|
|
Bladder |
10.00 |
4 |
4.5 |
4.2 |
0.7 |
|
Bone |
20 |
4 |
4 |
11.3 |
1.4 |
|
Bowel |
7.5 |
4 |
9 |
14.4 |
1.4 |
|
Brain |
15 |
4 |
12.5 |
5 |
2.1 |
|
Kidney |
37 |
4 |
9 |
16 |
0.1 |
|
Larynx |
25 |
4 |
3.5 |
7 |
3.5 |
|
Liver |
20 |
4 |
14 |
4.2 |
8.5 |
|
Melanoma |
n/a |
n/a |
5 |
NO DATA |
NO DATA |
|
Myeloma |
20 |
4 |
4 |
8.5 |
2.8 |
|
Oesophagus |
12.5 |
4 |
6.5 |
10.6 |
4.9 |
|
Oral |
10 |
4 |
6.5 |
4.2 |
4.9 |
|
Ovarian |
8 |
4 |
8 |
14.5 |
0.1 |
|
Pancreas |
10 |
4 |
3.5 |
4.2 |
3.5 |
|
Prostate |
20 |
4 |
13.5 |
6.8 |
3.5 |
|
Stomach |
11.3 |
4 |
3 |
4.8 |
2.8 |
|
Testicular |
8 |
4 |
8 |
3.8 |
5.6 |
|
Thyroid Breast -4years |
6.4 |
4 |
7 |
4 |
0.1 |
|
Leukaemia |
|
.5 |
.5 |
.5
|
|
|
|
|
|
MEAN SD |
7.7 |
2.9 |
|
Table 1 Latency Data from Barnes (ref) |
|
|
|
|
|
|
|
|
|
|
|
|
Results and Discussion
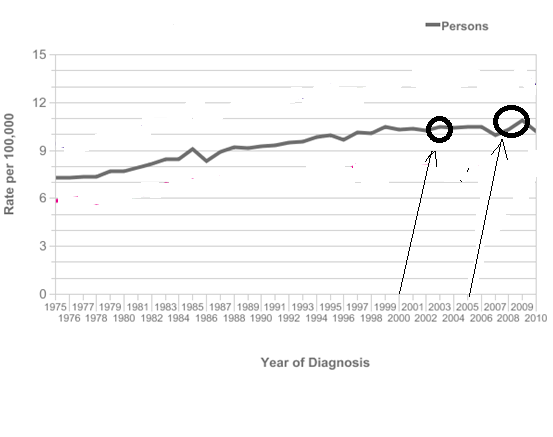
Leukaemia has the minimum latency period, so is perhaps the obvious starting point from which to test the hypothesis, see figure 1.
Figure 1
In 2001 there was a 3% rise in Leukaemia incidence. In 2006 -2007 there was approximately a 10% increase in Leukaemia rate. This is perfectly consistent with the hypothesis given an up to 1 year latency period, see arrows and encircled regions on 'all persons plot' figure1. Then from 2009 -2010 there was a 7% decline in the Leukaemia rate probably consistent with the pub smoking ban.
Over the same period, approximately 2003-2009 there was a 6% increase (figure 2) in breast cancer. Since the minimum latency period for breast cancer is 4 years it is too early to say if there will be a corresponding fall although polynomial analysis suggests this might be going to be the case (13).
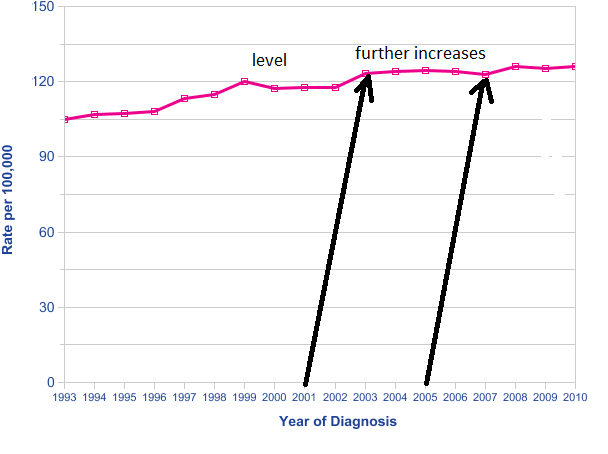
Figure 2
Although stomach cancer is generally declining, the rate of decline slowed in the period 2003-2009, see figure 3.
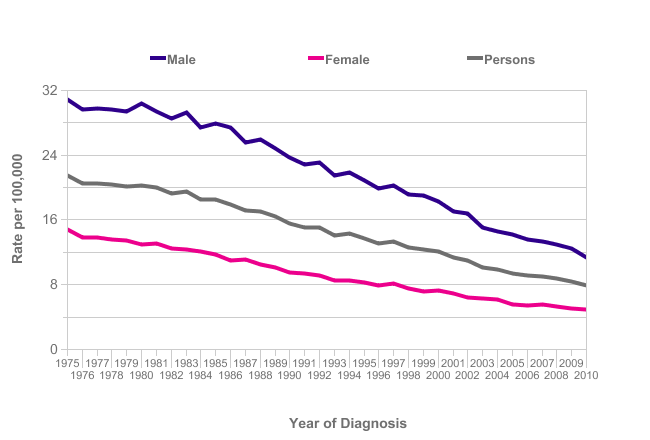
Figure 3
NHL (non-Hodgkin Lymphoma) has a very short latency period similar to Leukaemia. Up until 2002 its rates were more or less saturated. Between 2002 and 2009 its rates increased again by 13%. By 2010 there is a slight levelling of the NHL rate suggesting it may have peaked and the smoking ban may be having an effect? See figure 4. This behaviour is very similar to leukaemia and may have a corresponding explanation.
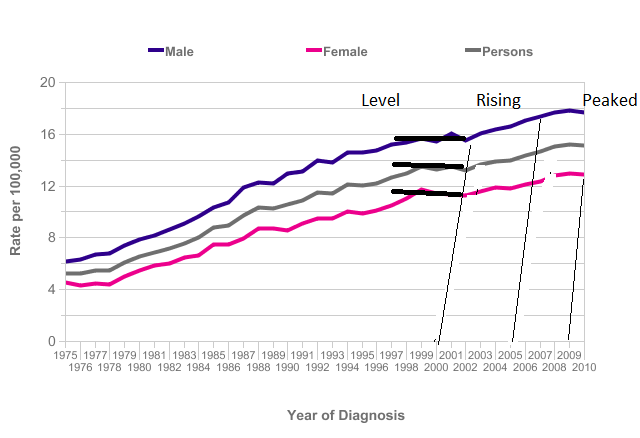
Figure 4
Malignant melanoma has been previously shown to have least correlation with melatonin (14) and this is borne out by there being a significant increase in melanoma prior to the changes in the licensing laws and no significant change in the slope of the trend line after the changes in licensing hours, data not shown but accessible at the cancer research UK website.
Conclusions
Both parts of the hypothesis are supported by the available data. At present it has only been possible to make associations for cancers with very short latency periods.
The USA has very similar cancer incidence rates to the UK with similar industrialisation, similar infrastructure and in particular use of Radio Frequency technologies yet with the exception of Thyroid cancer most of its cancer incidence rates have saturated since the early 2000’s. Barnes has previously suggested that the penetration of RF technology in the UK may be lagging that in the US somewhat, thus accounting for the observed differences. Undoubtedly the effects of pub licensing and tobacco rules revealed here adds an additional dimension of complexity.
References