North Wales ( Gwynedd) Winter
and Summer Temperatures since 1917
influence of Solar Cycle and prediction of a QBO ( quasi-biennial
oscillation) and definition of its average length, by Dr Chris Barnes, Bangor Scientific
and Educational Consultants, April 2015.
Abstract
Control
and feedback mechanisms in the earth climate system are very briefly
discussed. NAO and the QBO are strong
indicators of winter temperature in Wales but are rather more irrelevant in summer. Thus a search for a solar link to summer
weather is made as an alternative. This
suggests Gwynedd’s recent extremes of weather could be due to changes in
the solar cycle. Analysis of a century’s worth of UK climate anomaly data
suggests that a shorter or longer than average solar cycle gives rise to an
increased incidence of both colder than normal winters and hotter than average
summers with a very high statistical
result for summers. The present work also suggests that Gwynedd will be on
average 1.07 C warmer which is closest to the IPCC B1 scenario and at the lower
end of their predication scale but that most of the change could be solar
induced. It is incredibly instructive to remove the data for the last and very
unusual 14 yearlong solar cycle. If this
is done then the warming slope changes into a dramatic cooling slope showing a
change of -5.7 C in the next 100 years. The data for winter and summer
temperature anomaly also allows extraction of a sinusoidal varying QBO like component
with a length of approximately 24.9 months if one constrains the solar cycle to
its average length.
Introduction
There
has been much debate recently regarding the extent to which climate is under solar
control and the extent to which anthropogenic change is responsible.
The
present author has recently explained how earths’ climate could be geo-magnetically
controlled [1] and further has
explained how a number of hitherto unsung feedback mechanisms appear to be
preventing ‘runaway’ global change [2].
Such mechanisms include ship and aircraft aerosol, increased plant terpene
production, and increased lightning NOX etc.
The former is only possible if there amplifiers in the
ionosphere-stratosphere-troposphere coupling system. Since this system is highly non-linear in
all its wave-wave coupling scenarios including; acoustic, gravity wave and
electromagnetic wave and in the DC global electric current then the presence of
such solar influenced amplification mechanisms is perhaps not so unexpected.
Furthermore
the present author has recently shown that both the NAO and the QBO are strong
indicators of winter temperature in Wales but are rather more irrelevant in summer
[3].
Thus it was decided to explore the influence of the Solar Cycle on winter
and summer temperature anomaly between 1917 and the present day.
Data Sets
Only
two data sets are required. Firstly, the temperature anomalies and secondly the
dates of the solar cycles. In this case the solar cycles being defined by
sunspot number rather than Ap
value. These are available from standard
online sources.
Data Summary
The data have been summarised in an
XL file.
|
Max
|
End
|
Length
max to max |
Coldest
winters |
Hottest
Summers |
||||
|
yrs+max |
||||||||
|
1906 |
1913 |
|||||||
|
1917 |
? |
11 |
1917 |
0 |
||||
|
1928 |
1933 |
11 |
1929 |
1 |
1933 |
min |
||
|
1937 |
1944 |
9 |
1940+41 |
3+4 |
1934+5 |
min+1+2 |
||
|
1947 |
1954 |
10 |
1951 |
4 |
1947+1949 |
0+2 |
||
|
1958 |
1964 |
11 |
1963 |
5 |
1955+1960 |
max-3+2 |
||
|
1968 |
1976 |
10 |
1977 |
9 |
1975and 6 |
min and min-1 |
||
|
1979 |
1986 |
11 |
1985 |
1979+1982 |
0+3+6 |
none |
||
|
1989 |
1996 |
10 |
1991+1996 |
0+7 |
1989+90+95 |
max+1+6 |
||
|
2000 |
2008 |
11 |
none |
03+04+06 |
max+3,4,6 |
|||
|
2014 |
? |
14 |
2010+2011 |
minus 3+4 |
2013+2104 |
max+max-1 |
||
Table 1: Main data set
From
the above, a dominant mode for the appearance of hot summers would appear to be
solar maximum plus an average of circa 2 years and strangely also at solar
minimum. A dominant mode for the coldest
winters would appear to be on average about 1.5 years before solar
minimum. Van Loon and Jeffery C. Rogers
(1978) [4] have remarked upon ‘The
Seesaw in Winter Temperatures between Greenland and Northern Europe.’ M
Lockwood et al 2010 [5], have
suggested that as a strictly ‘European’ effect colder winters are associated
with Solar Minimum. Kodera (2002) [6]
has discussed the ‘seesaw’ in terms of the NAO and AO. QBO may also be relevant, Labitzke
(2005) [7] has discussed this. At 1.5 years before solar minimum the
extracted QBO signal is just swinging from +ve to
negative in phase. For 75% of specific
winters examined here QBO is negative.
At solar maximum plus 2 years the QBO
signal is close to zero. In reality this was also the case with one of
Britain’s hottest ever summers, that of 1976.
Further Analysis of Results and
Discussion.
Length of solar cycle
It
is intuitive to plot the number of occurrences of hot summers against length of
solar cycle and number of cold summers against length of solar cycle
separately. Considering cold winters
first. A linear correlation plot shows
no statistical relevance whatsoever. However
and more instructively a quadratic correlation shows a weak but interesting
effect, see Figure 1 below:
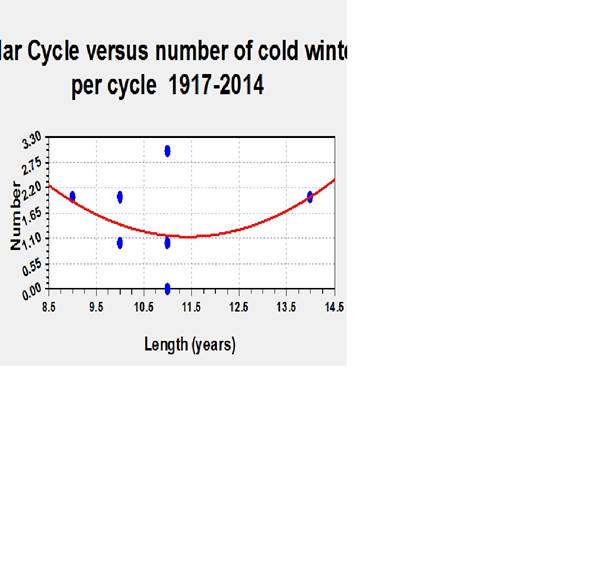
Figure
1: Solar cycle length versus number of
Hot Summers in century
It
can be clearly seen that the number of harsh winters minimises for the average solar
cycle length of 11 years and maximises for cycles which are shorter and longer.
A
long solar cycle is of course tantamount to saying there are longer periods with
fewer sunspots as happened in the Maunder minimum etc.
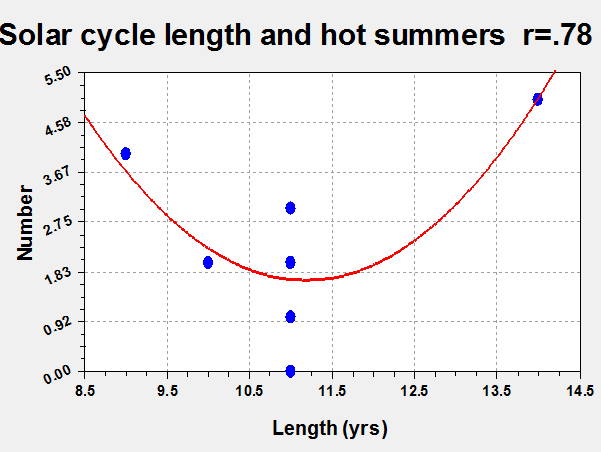
Figure 2: Solar cycle length
versus number of Hot Summers in century
Perhaps
somewhat surprisingly the same general trend is seen for hot summers as for
cold winters. The shorter and longer the cycle, the more hot summers are
present. The difference is of
statistical significance, as here the P Value Results r=.78 DF=10
give a two-tailed P value equals
0.0028and by all conventional criteria, this difference is considered to be
very statistically significant.
Whereas
with the data for cold winters because the regression coefficient was much
lower P could not be defined with any certainty.
The
above result is, indeed, highly significant.
It tends to suggest that both longer and shorter than average sunspot
cycles drive more extremes of weather.
The harbingers of climate doom have been telling us for a while now
about Britain’s more extreme climate and suggesting that it is down to
anthropogenic change. The data acquired
here represents 100 years of data tends to suggest that it still very firmly
the sun and not human kind which are in control of the Welsh weather. It is interesting to note that the warming
effect of short solar cycle length has been observed previously by Friis-Christensen and Lassen (
1991) [8] but it is believed that
this is the first time that such an effect has also been observed for a longer
than average solar cycle. Estimates for
the length of the next solar cycle vary considerably from as low as 12 years to
as high as 17 years. Thus based on solar influence alone the Welsh climate
could either return to a more stable regime or continue to be one of wild
extremes. Sadly, and presently we are still too close to solar maximum to say
with any certainty.
QBO
There
has also been much debate recently about the significance of the QBO and if and
when and where the QBO signal appears and to what extent it needs to be built
into climate models.
Because
the Met Office data set for temperature anomaly since 1917 is effectively a
colour coded set of GIS like maps, see [9],
it has not been possible to evaluate precise figures. However, the present
author has taken a cold winter to be one on average equal to or below 1 C less
than the figure normally expected and has taken a hot summer to be the reverse
i.e. at least 1C greater than the average for the period as expected.
The
data have then been treated in the following way. The sunspot cycle has been assumed to be its
average value of 11 years long. Further the peak of the sunspot cycle has then
been assumed to be central i.e. 5.5 years after the start of previous trough
and 5.5 years before the next.
A
graph has been constructed representing an idealised solar cycle with abscises 0-11 (years) and ordinates -1 to +1 (Celsius) , for all
the available cold winter and hot summer data between 1917 and 2014 and a sinusoidal
fit has been applied.
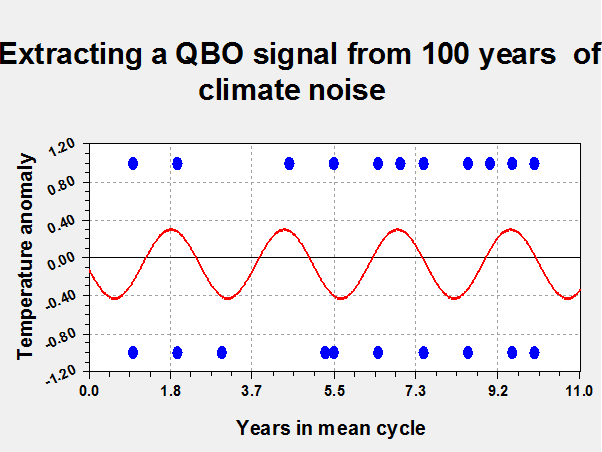
Figure
3: Attempting a QBO extrapolation
Approximately
5 cycles of QBO like behaviour are observed. Yielding a QBO period of between
24-24.9 months. Of course in reality
neither the solar cycle nor the QBO is fixed and this accounts for the low
correlation factor of some .25. Labitzke (2005) [10]
was the first to introduce the constructed annual mean of the solar cycle–QBO
relationship. This present work adds
considerable weight to his idea.
The
latest hypotheses as to the variability in such cycles involves gravitational
and magneto-electric solar and inter-planetary beats [11], [12] and seem to the present author highly plausible yet none
are taken into account in today’s meteorology.
Is the climate
warming?
A
unique way to make an overall assessment on climate is to re-plot the data from
figure 3 using a linear extrapolation, remembering that it is data acquired across
a total number of 11 complete solar cycles.
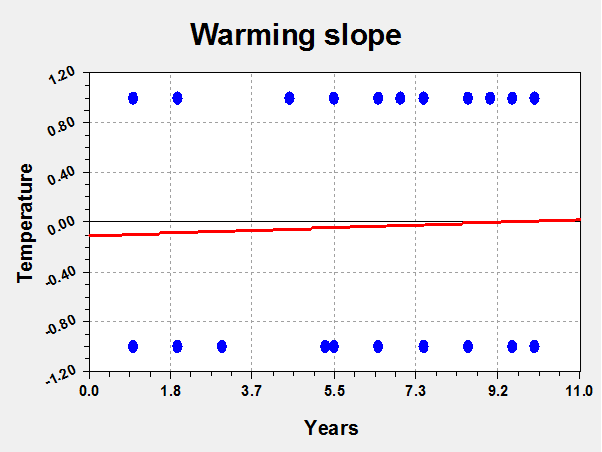
Figure 4
: Climate warming in last century
By
2099 the above warming slope predicts that Gwynedd will be on average 1.07 C
warmer which is closest to the IPCC B1 scenario and at the lower end of their
predication scale, see https://www.ipcc.ch/publications_and_data/ar4/wg1/en/spmsspm-projections-of.html
[12].
Remembering
the strong solar effect, figure 2, it is possible that far more of this warming
has been due to the sun alone and far less due to anthropogenic causes than
envisaged by the IPCC. It is incredibly instructive to
remove the data for the last and very unusual solar cycle. If this is done then the warming slope
changes into a dramatic cooling slope showing a change of -5.7 C in the next
100 years. To the present author
it is almost as there is divine control at work trying to keep our planetary
system stable.
Conclusions
The
results of the present work leads to a conclusion highly suggestive that Gwynedd’s
recent extremes of weather could be due to changes in the solar cycle. Analysis
of a century’s worth of UK climate anomaly data suggests that both a shorter or longer than
average solar cycle gives rise to an increased incidence of both colder
than normal winters and hotter than average summers particularly with a result of very high statistical significance for
summers.
The
data for winter and summer temperature anomaly also allows extraction of a
sinusoidal varying QBO like component with a length of approximately 24.9 months
if one constrains the solar cycle to its average length. This length is very comparable
with the standard accepted range for QBO periodicity.
A
linear extrapolation of the same data allows an estimate to be made for climate
warming which is closest to the IPCC B1 scenario and at the lower end of their
predication scale.
It
is hoped that the above public domain publication will advance the frontiers of
general and meteorological science and the author is willing within reason to
attempt to answer questions from most quarters.
References
1. http://www.drchrisbarnes.co.uk/SOLARMAG.htm
2. http://www.drchrisbarnes.co.uk/GEOINDEX.htm
3. http://www.drchrisbarnes.co.uk/CLI.htm
4. http://www.geography.ohio-state.edu/faculty/rogers/pubs.html
5. Environ.
Res. Lett. 5 024001 doi:10.1088/1748-9326/5/2/024001 http://iopscience.iop.org/1748-9326/5/2/024001
6. http://onlinelibrary.wiley.com/doi/10.1029/2003GL017290/pdf
7. https://www.terrapub.co.jp/onlineproceedings/ste/CAWSES2007/pdf/CAWSES_257.pdf
8. http://www.sciencemag.org/content/254/5032/698
9. http://www.metoffice.gov.uk/public/weather/climate-anomalies/#?tab=climateAnomalies
10. http://strat-www.met.fu-berlin.de/labitzke/summary/JASTP-Labitzke-2005.pdf
11. http://arxiv.org/pdf/1307.3706.pdf
12. http://www.drchrisbarnes.co.uk/PBMAG1.HTM
13. https://www.ipcc.ch/publications_and_data/ar4/wg1/en/spmsspm-projections-of.html
[