Super-
sleuthing the Hum, by
Dr Chris Barnes, Bangor Scientific and
Educational Consultants, Gwynedd, Wales LL57 2TW. Draft version July 2020.
Abstract
Some existing protocols for
low frequency noise ( LFN) measurement are discussed and shown to be
inadequate. A new method of taking LFN
measurements not only at the external façade but also centrally in affected rooms and on the inner surfaces
of their windows and load bearing walls
is described. The method allows quick identification of airborne and ground
borne components. Acoustic signals appear to be generated by house windows and
walls, some of which are at power system frequencies and sub-harmonics and are
present even when the mains electricity is turned off. Similar and simultaneous frequencies are confirmed by electric
potential measurements in the fabric of the walls and by magnetic field
measurements, which based on recently discovered properties of architectural
materials such as brick and concrete suggest that in our homes we are all
effectively living within a vast loudspeaker.
The discovery is shown to provide a new and highly feasible explanation
of the hitherto enigmatic LFN phenomenon referred to as the Hum. Further an explanation of the time evolution of the history of the Hum
first appearing in the UK and not until some 20 years later in the USA is
offered in terms of the effects of PME electrical earthing technology on
electrical ground currents. Ground
current frequency spectra are shown to change dramatically when the Hum is
present and to match those measured at electricity sub-stations and for power
grid systems in general. It seems likely
that only when power systems are behaving unstably and with additional
frequency components as to create ‘comb’ spectra that strong Hum is observed,
at least by the two subjects in this present study. Most likely instability at the source or
sink of a power system could create the Hum.
Also, the possibility exists that present-day Hums are accentuated by
the growth in renewable energy systems.
Some have suggested that ground
vibrations from other utilities such as gas and water may have a part to play
in the Hum. At least at the author’s
premises this does not seem to be the
case, but some further work remains to be done.
Introduction
In this paper I will show that we all are in fact effectively
living within a loudspeaker! Is it time
therefore to re-assess how we define and deal with low frequency noise? I will approach the topic through a partial
examination of the literature and some personal experimentation. Moreover, I will explain how airborne sound,
architectural acoustics, seismic vibration and electromagnetics and our
nation’s choice of electrical earth system may have come together in a unique
interface to give us the enigmatic low frequency noise phenomenon commonly
referred to as the Hum. The paper
should be of interest not only to acoustics and environmental health
professionals but also to amateur radio, electronics and computer hobbyists who
can easily make their own measurements according to the procedures I will
describe.
Noise in general has emerged over the past few decades
as a leading environmental nuisance in the WHO European Region, and the public
complains about excessive noise more and more often. Low frequency noise is defined as noise with
most of its components at frequencies below 200 Hz. Below 20 Hz the low frequency noise is
strictly defined as infrasound. It is, however,
a fallacy to believe that humans cannot perceive infrasound they merely require
a higher sound pressure level to do so [1]. Although the cochlear may have less
involvement with infrasound, other sensory cells or structures in the inner
ear, such as the outer hair cells, are more sensitive to infrasound than the
inner hair cells and can be stimulated by low frequency sounds at levels below
those that are heard. The concept that an infrasonic sound that cannot be heard
or can have no influence on inner ear physiology is incorrect.
In fact, under some clinical conditions, such as
Meniere’s disease, superior canal dehiscence, or even asymptomatic cases of
endolymphatic hydrops, individuals may be hypersensitive to infrasound [2].
According to Leventhall [3], low frequency noise, the frequency range from
about 10Hz to 200Hz, needs to be
recognized as a special environmental noise problem, particularly to sensitive
people in their homes. Conventional methods of assessing annoyance, typically
based on A-weighted equivalent level, are inadequate for low frequency noise
and lead to incorrect decisions by regulatory authorities. There have been many
laboratory measurements considering annoyance to subjects by low frequency noise, each with different
spectra and levels, making comparisons difficult, but the main conclusions are
that annoyance of low frequencies increases rapidly with level. Additionally,
the A-weighted level underestimates the effects of low frequency noises. There is
a possibility of learned aversion to low frequency noise, leading to annoyance
and stress which may receive unsympathetic treatment from regulatory
authorities.
Noise is an underestimated threat that can cause
several short- and long-term health problems, such as for example sleep
disturbance, cardiovascular effects, poorer work and school performance,
hearing impairment, etc. The vibrations of low frequency noise and
infrasound can cause all the foregoing together with damage to lung tissue as
well, so called vibro-acoustic disease [4].
Most people typically describe low frequency noise as
something like a low rumble, a buzzing, a pulsation, a vibration or a
pressure or a popping within one or both
ears and any combination of these.
Only a small proportion of people
are affected, but those who are can be severely distressed, can lose sleep and
suffer other symptoms like depression. Sometimes the complaint can be traced to
a single sound source, typically an industrial site, or an adjoining property.
If the source can be found, then there is a chance the noise can be controlled.
In most cases where a sound source can be traced, it
is ‘airborne’, meaning that it travels through the air as a sound wave and
enters the dwelling through windows, roof, etc.
Sound can also be ‘ground-borne’, meaning that it travels through the
ground and is converted into sound in the dwelling, or is sensed as vibration. One of the characteristics of low frequency
sound is that it can travel relatively long distances without much attenuation
(reduction in level). It is not uncommon that a source is traced to a site
several kilometres away from the complainant’s property.
However, in some cases no single sound can be traced
that could account for the disturbance.
This can be distressing, especially if to say a single
sufferer the sound could appear to be loud, even deafening whereas others
cannot hear it. A partial explanation for some cases is as follows: disturbance
by LFN is known to occur at levels only slightly higher than hearing threshold,
which varies from one individual to the next. Also, loudness
varies rapidly with level at low frequencies so a sound only slightly above one
person’s threshold could appear loud to them yet inaudible to someone else. So, for example if the investigator cannot
even hear the noise in the first place, they
might not be very sympathetic to the cause. Although there is some logic in this argument
it does not explain anything like all cases.
As seen above, there is a strong case to treat LFN separately from other types of environmental noise. Unwanted sound in the environment is commonly referred to as environmental noise. The Environmental Health section of your local authority is responsible for ensuring that environmental noise does not cause a nuisance. There are established procedures for assessing environmental noise from industrial sites which are based on measurements of the so-called dB(A). The term dB is an abbreviation for decibels which are the units for measuring sound. The (A) means that the sound is filtered to mimic the varying sensitivity of the human ear at different frequencies. Whilst this procedure works well for most industrial noise, the ‘A’ filtering operation strongly attenuates (reduces) the low frequency content of sounds. Thus if the dB(A) measurement scale were applied to a LFN it most likely will not show up any problem. Therefore, several countries have adopted separate guidelines for assessment of low frequency noise.
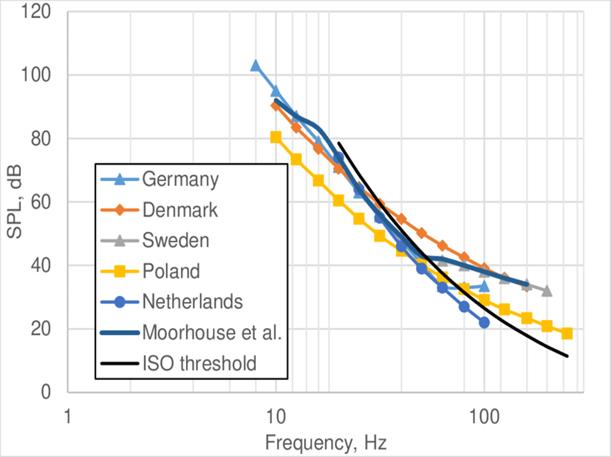
Figure
1: Comparison of thresholds for action against LFN in various countries.
For example, it can be seen that at 10Hz Poland is
more stringent than Germany by almost 20 dB.
The characteristics of the LFN known as the Hum are
commonly somewhat narrower than those for LFN as a whole, often being described
as sounding rather like a very large bee trapped and muffled in a bottle or a
distant but irregularly idling engine.
They seem worse in the quiet of night and very difficult to screen out,
sometimes even with earplugs. A comprehensive
search suggests these too to be very similar to the properties of high-level
infrasound. Some
have suggested that the Hum many be a single worldwide phenomenon, see for
example Deming (2004) [5]
whereas others have suggested the involvement of otoacoustic emissions [6]
and still others have suggested it is due to mixed source and even ground borne infrasound components [7-9]
. A modern potential cause of some cases of the
Hum may be wind turbines [10] but
since the Hum as a general phenomenon predates these then they are unlikely to
be the sole or the main cause. Wind
turbines do however produce fluctuating noise and their pressure waves can
modulate other noises in a phenomenon known as OAM. Low
frequency noise specific criteria have been introduced in some countries, but
do not deal adequately with fluctuations. Validation of the criteria has been
for a limited range of noises and subjects.
Earlier causes of the Hum have been suggested to be motorways and gas
mains [11] . More recently Leventhall
has suggested that the Hum could have its causes seated in things like
Ventilation Fans, Diesel Engines, Buses, Diesel Generators, Air and Water
Pumps. Whereas MacPherson [12]
has re-iterated the idea of traffic and has also suggested air traffic, mining,
blast furnaces, large air ducts and electrical sub-stations as possible
causes. Given the history of the Hum
and the fact that it was first observed in the UK and more latterly in the USA
and both countries have all these forms of transport and pieces of
infrastructure it is at first sight very difficult to see how any of them could account
for the Hum as a widespread and ‘general’ phenomenon although I will revisit this angle later
in this work, especially from the perspective of electrical sub-stations.
These bands usually have a bandwidth of one octave or
one third octave. More advanced instruments may be able to give a narrow band
analysis of the noise data. This may be an FFT (Fast Fourier Transform) or
information in 1/12 octaves.
An octave band is a frequency band where the highest
frequency is twice the lowest frequency.
For example, an octave filter with a centre frequency
of 1kHz has a lower frequency of 707Hz and an upper frequency of 1.414kHz. Any
frequencies below and above these limits are rejected. A third octave has a
width of 1/3 of that of an octave band.
A 1/12 octave band has a frequency width of a quarter of that of a 1/3
octave band. An FFT system can be
adjusted to any frequency window and any frequency step but is far more
expensive. Basic sound meters retail
for as little as £70 but octave band and
FFT based systems may be circa £5000.
Different
countries all apply slightly different methods and weightings to the assessment
of LFN [13]. Likewise,
different countries estimate the attenuation due to the façade
differently. What is interesting is
that at frequencies as low as 8 Hz is
that facades provide zero attenuation and there is some evidence to suggest
that even lower frequencies may actually be amplified by up 7dB by the façade, see Figure 2.
For example, it has been stated
that the levels of infrasound from wind farms are too low at property facades
to be perceived within but that amplification by window vibration may be a
mechanism for actual perception and similarly with other weak airborne
noises.
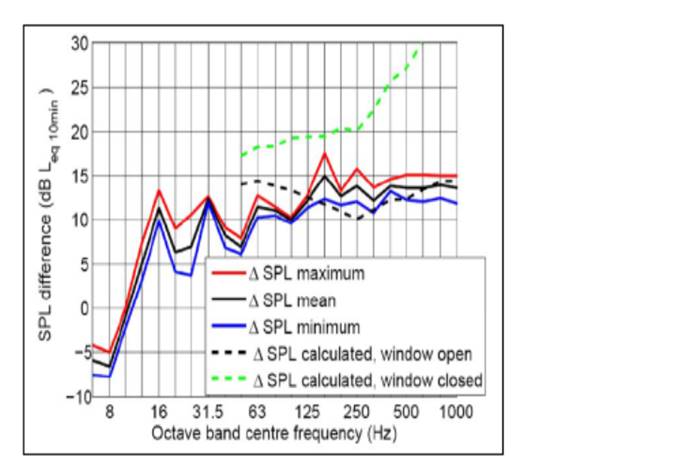
Figure
2 Typical Façade attenuation near a wind farm
for wind speed =1.1m/s.
Some have
discussed the need to completely re-assess the way we deal with and assess LFN
in that no one acoustic weighting is ideal and in that in psychological
acoustics pure tones are perceived more than broad band noise and those intermittent or pulsating pure
tones can be even more annoying. Thus, only by discrete frequency analysis
can one really know what is going on.
Councils and Local
Authorities have tended to oppose such suggestions due to equipment cost
limitations.
Air borne noise at
the façade is not the only way noise can enter
premises. The other possible
route is by ground borne vibration, involving either bulk, shear, or surface (
Rayleigh) waves. Perhaps somewhat unexpectedly, Leventhall (2003) [14] claims that LFN cases due to ground vibration
are in minority or extremely rare, this is perhaps somewhat surprising since he
discussed the it as a major cause not three years earlier! [8]. Even more
surprising given that ground
borne vibration is virtually impossible to stop and can travel very large
distances relatively un-attenuated, see
Srbulov, Ground Vibration Engineering: Simplified Analyses with Case
Studies and Examples [15].
The picture we are
building up is fast suggesting that the true picture of LFN must be a
function of both source and sink; i.e. the architectural nature of the premises
the sound finishes up is as critical to its perception as the nature of the
source itself. Hitherto this is simply not and never has been
considered by local authorities in LFN assessment. Moreover, such authorities
are usually obliged to seek a single offender when it comes to noise
problems. And even considering
Occam’s razor, things are rarely that simple. For example, one of America’s most
well-known LFN problems from the 1990’s, the so-called Kokomo Hum was shown to
be the result of two separate acoustic sources beating together. These were a 10Hz tone with measurable
harmonics up to 60Hz and a 36 Hz tone. A
360-degree rotating dual-microphone boom was used outside at three locations to
localize the 10 Hz tone to air
compressors in an
industrial facility near
the center of
the City. The
36 Hz tone
was localized to
a cooling tower
on the roof
of another industrial
plant in a
different section of town. In
each case, the tones were clearly detectable at more than a 1 km, see Cowan
(2008) [16]. When the tones
were alleviated most but not all residents got
relief. One possible reason is sensitization. Once an individual is sensitized to an
environmental sound, they will sub-consciously seek it or a similar sound or frequency components out, possibly even hearing it or perceiving at much lower levels, rather akin to a radio
signal almost buried in noise.
The only other facet of the Kokomo
investigation noted by Cowan found
higher than average 60 Hz A.C. magnetic fields in some of the affected
resident’s houses of values between 3-50 mG.
Based on these and the values of
magnetic fields found in the homes of dwellers in the USA’s other Hum hotspot, namely Taos, New Mexico,
it was suggested that possibly electro or magneto- phonic hearing might be a
mechanism for some to perceive the Hum.
Very recently indeed evidence has been presented to suggest that just
like birds, humans may actually be able
to perceive the earth’s magnetic field and subtle changes therein, see Wang
(2019) [17]. Could this be an additional mechanism for perception
of and/or entrainment to the Hum? As
I mentioned earlier there is often learned aversion to low frequency noise. It certainly seems with some individuals
that once one is sensitized to one source one may also become receptive to
similar sources be they acoustic or electro-magnetic or a combination of both
and this may, to some extent, have accounted for the incomplete resolution of
the Kokomo Hum case and even ongoing reports to this day.
Hypothesis: a
new way of assessing LFN
I
propose a new way of dealing with LFN where we examine not only the noise
levels at the façade but also the precise frequency components as well. Moreover, frequency components should also
be investigated within affected premises in multiple places such as the center
of rooms, the windows, the walls and floors.
This will allow separation of sources and differentiation routes of
entry i.e. airborne or ground vibration. It will also test to see if any
architectural features are generating sounds for other reasons. I see
this as essential, as undoubtedly some more complex cases of LFN
or Hum will be found to be due to beating of multiple acoustic components which
are either arriving from the same source
via multiple paths or from different
sources, as was the classic example of the Kokomo Hum. Non-linear acoustics within the human
cochlear can allow beats to form, thereby increasing perceived annoyance. Because professional octave band and FFT
analyzers are prohibitively expensive
for home use, I decided to use a piece
of Freeware designed primarily for the Ham Radio market and known as Spectrum
Lab [18] . Whilst it is possible to use Spectrum Lab
on a Laptop computer in conjunction with the built-in electret microphone, I
would caution against this especially with a Laptop with a conventional hard
drive and cooling fan both of which will
of course generate internal chatter noise and vibration usually in the region
of 90Hz.
A
technique I used instead was to create an external low frequency microphone
using a bass loudspeaker ‘in reverse’.
Such a system as a ‘big ear’ and it was first used in the Taos Hum
investigation. For those not familiar
with the idea, it is the same as a homemade sub-kick microphone [19]. I used a 12 inch woofer speaker. Such a microphone can, if necessary, be
used on the end of a long and screened
cable to get the laptop into a completely different room. Moreover, the low frequency response can be
increased by sticking additional mass onto the centre of the speaker cone. I found that loading the cone with a 1kg
mass could give a response down to a few Hz.
Personal
experiments
Doing science with a
phenomenon like the Hum is notoriously difficult. This is because most reports are anecdotal
unless one is privileged enough to conduct interviews with afflicted
subjects. Even then, when asked for
example, to ‘tone match’ the Hum many come up with different frequencies. I do not view this as entirely unreasonable
given that often skewed sound spectra with multiple narrow band ‘carriers’ some
of constant amplitude and some pulsating are often found in the homes of people
afflicted by the Hum. So yes one could
label the Hum a ‘psycho-acoustic’ effect but non-the-less a very real effect
rather than an imagined or internal effect such as tinnitus or an effect perpetuated by conspiracy
theorists or the ‘tin hat brigade’!
I had read the work of Dawes way back close to start
of the Bristol Hum. Some at that time
had claimed the Hum was associated was the then
Radio Navigation System known as Loran C but Dawes eventually claimed that the Hum was somehow connected
with the electricity supply industry and was still doing so recently [20]. Dawes’ early work, published only on his
then website, referred to measurement of
a varying AC ‘wall’ voltage measurable
by sinking meter probes into house plaster work
and moreover the finding that this voltage was not in phase with the
house mains voltage, that it varied by time of day and that it was still
present even with the house electricity supply turned off. Unfortunately, these original
references no longer appear to be
on-line. I decided to duplicate Dawes’ experiment. Sure enough an AC wall voltage was
found. Moreover, placing a powerful
magnet changed the induced voltage.
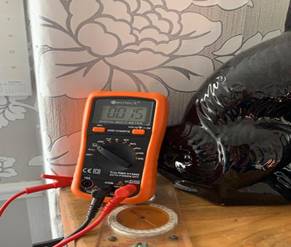
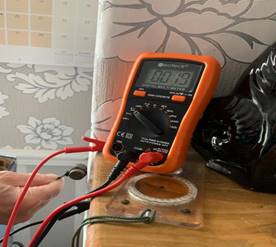
Original wall voltage
15mV AC over 15cm Wall
voltage with magnet in situ
Thus,
I could only assume that brick must be a piezoelectric material with magnetic
properties to boot. A little more
research produced the evidence I had been looking for. Namely that brick is indeed both a
piezoelectric material as evidenced by acoustic emissions during bending [21], an electret style supercapacitor
because of its porosity [22] and together with cement is also a magnetic
material [23]. The thought
occurred to me that not only would house walls radiate ground borne seismic
vibrations, but they would also act as electro-acoustic converters and
magneto-acoustic converters to boot, directly converting changing electric and
magnetic fields to sound. I would
thus most certainly expect a certain acoustic ‘richness’ if I were to place my
big ear on the walls of the house, especially the load bearing walls most
stressed so expected to produce most piezo-electric effect.
The first experiment I conducted was simply to take a
set of narrow band acoustic measurements in the centre of the master bedroom of
the house, one affected badly by the Hum.
Two scientific subjects were used in the experiment, namely my wife and
I, both readily perceive the Hum. I
took simple frequency only measurements using
the ‘big ear’ and Spectrum Lab on several occasions when the Hum was
present, one occasion when there was an obvious LFN from a ‘boy racer’s’ sound system outside the house and on the
only occasion I could record when the Hum was not perceived. The results are presented in Table 1 below:
|
0-10
Hz |
10..20
Hz |
20..30
Hz |
30..40
Hz |
40--60
Hz |
60..100
Hz |
100..200
Hz |
>200
Hz |
|
|
Y1 |
3.3,
5.5, 9 |
31,34 |
50P |
|||||
|
Y2 |
17 |
22 |
31,33 |
50P |
78 |
|||
|
Y3 |
19 |
32 |
50
P,58 |
66 |
||||
|
Y4 |
5,7 |
13,16.5 |
22.5 |
33 |
50P |
|||
|
Y5 |
2,4 |
10.5,14 |
23 |
46,50P |
60 |
|||
|
Y6
STRONG |
5,6 |
12,14 |
22,27 |
32,40 |
50P |
60 |
||
|
Y7
(LFN) |
15,18.5 |
21,23 |
31 |
50P |
61,65,68,73,75 |
|||
|
N |
26,27 |
50
B/C |
B |
B |
||||
Table 1
The most striking commonality in the above table is
the presence of infrasound below 20Hz on each occasion when the hum is
perceived by both subjects. The most
intense Hum, condition Y6, seemed to
correspond the presence of most narrow
band infrasound below 20 Hz and with most narrow band sound below 60 Hz with
acoustic silence at higher frequencies.
When the Hum was not present there was no infrasound, no narrow band acoustic sound in the region
of 30-33Hz and broad band acoustic sound
at and above 50 Hz.
An example of the
spectrum lab plot obtained is
shown for Y1 is shown below.
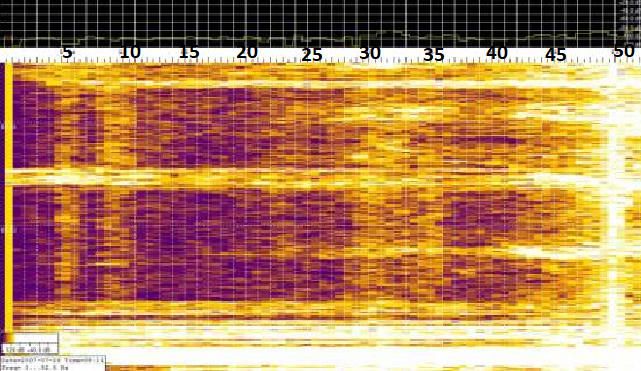
Spectrum
Lab Plot Y1
The original screenshot has been reduced in size and
the frequency scale was not clear, so I have superimposed it in larger
print.
Note how the 50 Hz signal appears to be
pulsating. When the Hum was not present
the 50 Hz signal amplitude appeared to be more constant.
In four out of the six recorded Hum instances I also
noticed frequencies in the region of 17
Hz. I wondered if I could somehow
synthesize a Hum like effect using acoustic synthesis. I used freely available software by V.Burel [24] ran on
additional laptops and speakers.
Following
the above subjective effects and initial hypothesis that the HUM needs more
than one external component for perception and that internal perception is a
function of human audition and that at all the above HUM sites infrasound
appears to be present at two or more frequencies below 20 Hz in addition often
to low frequency sound in the region of 30 Hz it
was decided to see if conditions could be set up experimentally which would
synthesise the HUM. The V.Burel
software was set up on two other computers and all three computer sound cards
were fed into separate loudspeaker systems. The subjects sat about 1
metre away from the loudspeaker systems and listened binaurally. It was found
that HUM like effects could be perceived for any infrasound in the region of
9-17 Hz when outputted at similar amplitude to any audio tone in the region
29-75 Hz. Particularly disturbing
effects were obtained as follows:
|
16.55 Hz |
49.731 Hz |
Hum-like effect |
|
16.689 Hz |
33.092 Hz |
Hum-like effect |
|
16.689 Hz |
50.261 HZ |
Hum-like effect |
A
third tone was not always necessary but equal amplitude tones of 4, 10 and 29
Hz gave a the most y disturbing effect and the subjects felt quite giddy for
several hours afterwards.
HUM
like effects with typical quasi-periodicity were also maximised for two tones
one audio in the range 29-75 Hz one infrasonic wherein the infrasonic tone fell
such that its third overtone was within 2Hz or so of the audio tone. The
results of these experiments give very strong support to the notion that at
least one component of the HUM is infrasonic and that it might never be
possible to measure a single HUM characteristic or single per se in that the
quasi-periodicity which subjects experience may well be an internal effect
related to the latency periods of linear and non-linear products in hearing.
Non-linear acoustic products of the human cochlea are known
to be of the form 2f1 – f2 at frequencies of the order of a few
kilohertz but odd harmonic generation n f1, n=1,3,5 etc. is known at lower
frequencies in line with the above result, see Gorga et al (2007) [25].
|
4 |
122 |
||||||
|
Window |
BROAD |
33 |
46,50 |
60,64,88 |
|||
|
Wall |
4,9 |
31 |
56 |
65 |
|||
|
|
|
|
|
|
|
|
|
Table
2
What
is particularly apparent is the lack of detail present at the façade. The frequency of 4 Hz is interesting and
may possibly be associated with wind turbines, see Jakobsen (2005) [26]. I
would expect this frequency to vary somewhat with wind speed. For example,
with three blades spinning at 16 RPM, a blade passes the mast 48 times
per minute, or once every 0.8 second (i.e. 0.8 Hz). Typical measurements of
wind turbine noise showed a peak in the spectrum at 0.8 Hz with additional
peaks at 1.6 Hz, 2.4 Hz, 3.2 Hz, 4.0 Hz, 4.8 Hz, 5.6 Hz, 6.4 Hz, 7.2 Hz, and
8.0 Hz, see measurements
by M.G. acoustics, Canada [27]. Although
looking at the results airborne wind-turbine infrasound at such very low
frequencies did not seem to be an absolute pre-requisite for perception of the
Hum by either subject, its presence
certainly seems to cause an intensification of the effect. The Hum in Britain of course pre-dates
abundant wind farms.
It is uncertain what the frequency of 122 Hz was. At this point, the origin of the
frequencies at 9Hz and those between 31 -88 Hz was uncertain. They might simply have been ground borne vibrations transmitted by the
walls and windows. Vibration of the
ground or of a building beneath one's feet is generally disliked and can be
annoying. Man is sensitive to mechanical oscillations ranging in frequency from
well below 1 Hz up to at least 100 kHz. This range of sensitivity to vibration
is much broader than the range of human hearing. Generally, vibration of relatively low
intensity of the kind induced in buildings and other structures excited by
traffic or industrial operations outside.
The human vestibular system is sensitive to vibration i.e. acceleration
in the frequency range .1-4 Hz. The
skin, muscles, and tendons sense vibrations up to several KHz. The visual system can also perceive
vibrations because of differences in the acceleration between the eye and its
socket. Human thresholds for vibration
as a function of frequency are shown in Figure 3 below:
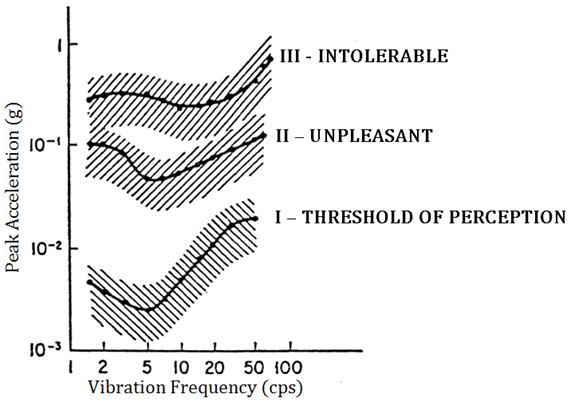
Figure
3
The author’s property has some four separate
substations with 400m. One of these is
associated with a local college of technology and the other three with a
University Halls of Residence site.
Either ground borne vibrations were coming from them or alternatively, it could be concluded that the
acoustic sound emanating from the walls and windows might be in some way be
internally generated.
The
question is posed what if the walls themselves could act in some way like a
loudspeaker? We have heard the
expression ‘walls have ears’, but could they have ‘mouths’ as well? This may then, in some way, marry up with
the ‘wall voltage’ first observed by Dawes in connection with the famous
‘Bristol Hum’.
I have shown
that brick is a piezo-electric material [21]. Hence if it has an alternating electric field
across it then sound radiation at that field frequency would be expected. Similarly,
brick and cement are known to also have magnetic properties. Thus, if they are magnetically polarized
in the earth’s magnetic field and further subjected to a
varying magnetic field I would expect the potential for sound radiation in this manner also. The converse could of course also be true.
That is if a sound field were to be directed at the walls from within, electric
and magnetic fields could be generated.
There was of course no explicit sound source within the house, but this
does not preclude the possibility of externally
driven room modes and resonances. The
house also has a chimney in the front
room, and I calculated in a possible
Helmoltz resonance in the region of 9 Hz
for that. It is vaguely possible
that fluctuations in outside air pressure could excite chimney resonance more
strongly sometimes than others which could in turn intermittently drive room resonance. If this were the case, I would expect a
reciprocal piezoelectric effect to generate frequencies of the region of 28 Hz within the wall but
this was not observed.
|
Mag |
2,3,5,8,9 |
10,13 |
28 |
30 |
40,50 |
60,67
Broad |
|
Electric |
3,7 |
16 |
36 |
50 |
Table
3
I concluded that the magnetic field is providing the 9
Hz found in the wall audio signal and moreover that between them, the electric
and the magnetic fields provide every other component in the 0-10 Hz range for
ALL Hum events other than the frequency
of 4Hz which I had already established as being airborne. In the band 10-20 Hz I find that the
electric and magnetic fields between them can provide components heard on Hum
events Y4 and Y5. I conclude that the
frequency of 28 Hz is probably not relevant.
The magnetic frequency of 30 Hz is very close to the 31Hz of Hum
events Y1, Y2 and Y7. The narrow band frequency of 50 Hz is
common to ALL Hum events. The
frequency of 60 Hz is common to Hum
events Y5 and Y6. It is possible
that there is non-linearity in the system.
Certainly, by considering sum and difference frequencies of the observed
electric and magnetic frequencies together with the 4 Hz and 122 Hz airborne frequencies, one can arrive at virtually every other frequency observed within the
room during any of Hum events Y1-Y7.
Figure
4.
Interestingly, observations of high AC background
magnetic fields have been made for both
the Taos and the Kokomo Hums. The
question arises as to how such fields can be present even when the power to the
house is turned off. The answer may
be in the PME earthing system which are now more or less ubiquitous in Britain and are described by SP Energy
Networks [ 29]. Essentially even when
the electricity supply is switched off, the earth conductor in the house is
effectively connected all the way back to the substation. It seems to the author that any phase
imbalanced currents may have the potential to flow through the earth under the
house. Hence there is a potential
coupling loop albeit high impedance involving the earth as sockets are grounded
into the brick and plaster work and the earth under the house itself.
If
I have a varying magnetic field, I expect an induced electric field by the very
nature of the architectural materials I have described. Thus, I also
tried connecting the wall voltage probes which were identical masonry nails
some 14 cm apart directly to an auto-RMS reading multi-meter. Present were both DC and AC voltages. The DC voltage varied between -17mV and
-23mV with respect to the upper probe. The AC voltage was of the order of 30
mV and was constant for periods of
several minutes when no Hum was present but was varying continuously and
randomly from 24-39 mV when the Hum was present, in this particular case on the evening of 18th
August 2020 starting at around 2210 BST.
Similar voltages could be measured between the brickwork on the outside
of the cavity walls of the house too.
The pulsating magnetic field at 50 Hz and the randomly
varying AC wall voltage seems very consistent with the presence of pulsating 50
Hz audio in the room as evidenced by the spectrum lab plot Y1. At least in the author’s house we would truly seem to be living
inside a loudspeaker.
The
system was tested for sensitivity by seeking to see if it could record natural
radio emissions like whistlers. Using the full scan range of DC to 5.6 KHz, a
whistler was captured early into the first night’s experimentation. Whistlers
are due to lightening interactions in the earth ionosphere cavity.
Indeed there is so much energy injected from whistlers
worldwide with up to 2000 separate lightning storms going on at any one moment
that it is thought they dominate ULF production in the magnetosphere.
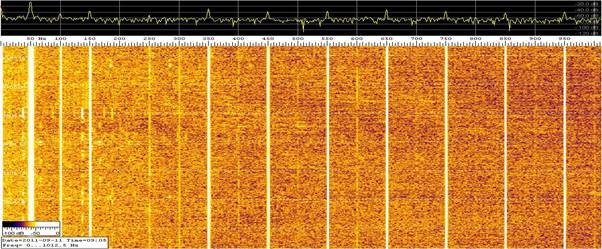
Spectra were recorded at various times on the 10th and
11th September 2011 when the Hum could be either be heard constantly, at other
times when it was fading in and out and finally at times when it had apparently
ceased. These spectra were recorded across various frequency ranges of interest
to home in on specific detail. Typical ranges of interest might be 0-700 Hz,
200-1700Hz and 0-5.6 kHz.
Results and Discussion of the Ground Loop Experiments
As predicted these results are in striking support of
the hypothesis. There are dramatic
changes in the ground current spectra when the Hum is present.
The results are simply image files of the
frequency-amplitude-time waterfalls obtained in each experiment. They yield up
striking differences across significant frequency ranges between the occasions
when the Hum was present and the occasions when it was not. After showing the
recording of a 'whistler' which validates the receiving system, it is then better
to continue with presenting the displays obtained when the Hum was not present
and discuss the features seen on these. This will be followed by the same for
cases when the Hum was present. In all cases there is a significant wealth of
information on each waterfall display.
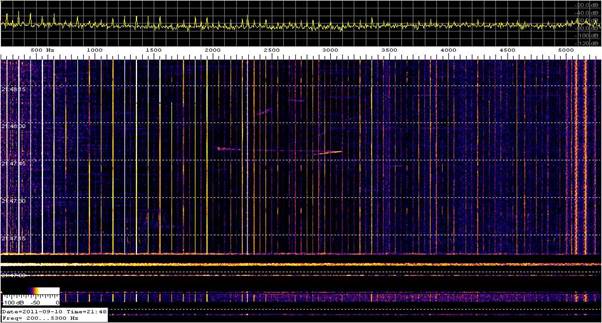
System Validation 2048 GMT 0-5.6 KHz
A strong whistler can be seen commencing at about 3.2
kHz and decaying in frequency down to about 2 kHz. This is followed by a
sequence of weaker, shorter lived natural radio events between 5 and 2.7 kHz.
UK mains frequency harmonics can also be seen.
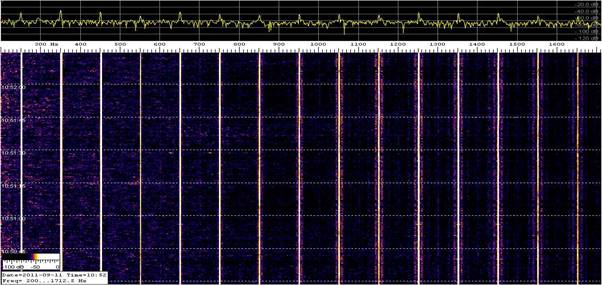
1047 GMT 0-1700Hz No Hum perceived
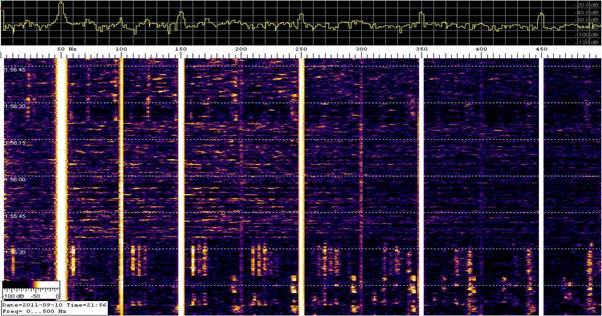
0-500 Hz 2156
GMT Strong Hum being perceived
Even as well as odd harmonics of the UK mains can be
seen and there are pulses of other frequencies at about 5, 10, 20 and 25 Hz
also at 60,75 95,120,125,130,160,165,170,190Hz and various higher frequencies,
with repeated similar frequency spacing. Note that some frequency separations
of 20 Hz are present a known characteristic of power line harmonic radiation.
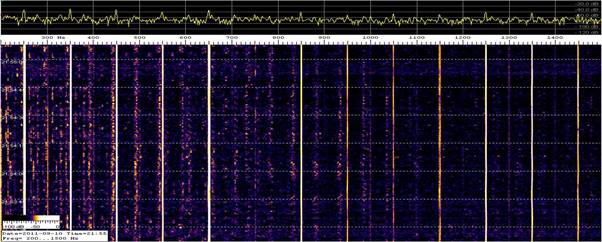
Hum perceived
expanded frequency range to 1500 Hz.
Weaker Hum being perceived
In addition to UK Mains fundamental and harmonics,
there are weak signal bursts at 10, 20, 40, 60,120,140,160,175 and 275 Hz.
When the Hum is perceived most strongly at the
author’s residence frequencies of 5, 40,50 and 60 Hz are found in the audio
spectrum. These frequencies have also
been identified in the above two ground current spectra. Interestingly acoustic frequencies of 40 and
50 Hz have been detected by National Grid in relation to a Hum in the Wrexham
area. Moreover, frequencies of
5,10,30,40,50 and 60 Hz were found in the magnetic spectra in the author’s
master bedroom.
General
Discussion
i)
Could the Hum
as a simple sound ever be recorded?
The brief answer is no. A more complex answer is that individual
frequency components of the Hum or even whole frequency spectra can easily be
recorded as seen above but that the precise sound any individual perceives
cannot for it will depend on their precise cochlear mechanics according to the
equations quoted earlier. However, it may be possible to make either
electronic circuitry or a computer algorithm to synthesize a noise like some
perceive the Hum. Since the Hum is so
low in frequency it may be necessary to Octave shift the frequencies to give
others any idea of what is perceived. This is something I may well explore in
future.
ii)
Can the time
history of the Hum be accounted for?
There are accounts of a Humming phenomenon as far back
in history as the dawn of the industrial revolution which was called the
‘Hummadruz’. This was a distant sound
like a swarm of bees heard outside at dusk and dawn a few kilometers from
Northern Mills and the like and thus not thought to be the same phenomenon as
today’s ‘indoor only’ Hum.
What is really intriguing is that contemporary Hum
reports in the UK began in the 1970’s, some 20 years prior to those in the
USA. Both are developed countries with
very similar infrastructure. UK
buildings are often somewhat different from US buildings especially in rural
areas where UK buildings contain more bricks and mortar and US buildings more
timber. Double glazing was also starting
to be used much more prevalently at that time.
The author noticed that the Hum intensified at his premises after
installation of double glazing which basically acts as a low pass acoustic
filter. Fox suggested that new gas
mains and motorways may be the cause of the 70’s Hum but the US has similar infrastructure, so I
doubt this. Britain built its first
pumped storage power stations in the 1970’s which may feature. Certainly there is a known case where the then CEGB actually paid
compensation for disturbances [30]. Yes, the US too has hydropower but being a
much larger land mass may make ground propagation effects less noticeable. I asked myself what further changes in
infrastructure began in the UK in the 1970’S not paralleled in the USA. Britain had TT earthing until the 1970’s [31] , and then
progressively changed to PME. Presently in the United States according to the National Electrical Code and
Canadian Electrical Code since the mid 1990’s the feed from the distribution
transformer uses a combined neutral and grounding conductor, but within the structure
separate neutral and protective earth conductors are used (TN-C-S). The neutral
must be connected to earth only on the supply side of the customer's
disconnecting switch. With the advent of
this grounding system, the Hum began. I
also wondered if by the 1970’s there was sufficient power density in the US
power grid to couple with the UK power grid via ionosphere modes and harmonic
radiation events.
.
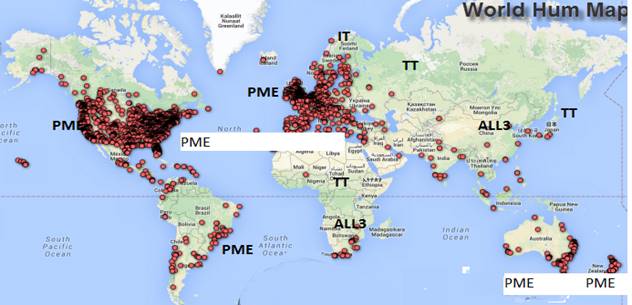
Figure
5
Are
there any other situations where we would expect the Hum?
As I explained earlier, there are several references
to and reasons for LFN sensitization. One hypothesis is that it is a phenomenon
connected with the fight/flight response [32]. Both the author and his wife have lived
through two moderate earthquakes. A
mini-survey I conducted suggested that a considerable percentage of Hum hearers
are earthquake survivors. It may be
once one has been exposed to the low rumble of an earthquake one generally
becomes more sensitive to LFN and vibration in general.
The
Hum and Cars
From the above results it is apparent that when the
Hum in the house is present, we are effectively living in what is almost
tantamount to a pair of acoustic and
magnetic comb spectra. One possibly
associated with wind turbine infrasound and the other associated with the
electricity grid. It is perhaps not that unremarkable then,
that after such sensitization, any other source which could provide a ‘comb’
might also provide Hum like effects?
On a number of occasions both subjects have noticed
hearing Hum like noises when parking up our cars upon engine off and one
alights while the other sits in the vehicle. I asked myself could there be some
feature of the vehicle’s electrical system that provides the Hum and a feature
of the body that acts as a loudspeaker.
I noted that when the vehicle stops,
and someone alights the interior light comes on and then slowly dims over a
period of time. The process is the same
for my Vauxhall car and my wife’s Landrover car. The process is essentially controlled by a
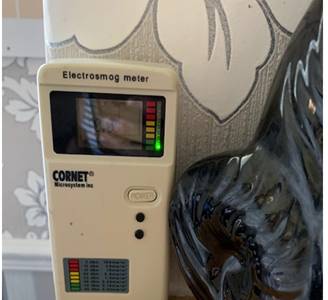
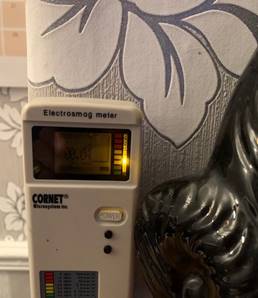
PWM system. I was able to detect both magnetic and
acoustic pulse in both cars as the lights dimmed as a ‘comb’ spectrum with a
fundamental frequency in the region of 15 Hz. I speculated that the acoustic generation was
due to out of phase earth return currents flowing from the interior lamp down
both frontal roof supports towards the bonnet and front wings and over the roof
to the rear of the car. Placing the
Cornet meter in these positions confirmed my suspicions and it could be seen
pulsing.
Once
the car interior light has gone out, the pulsing stops and so does the Hum like
effect.
Parked
cars under high voltage power lines.
The other place where both subjects have perceived a
Hum similar to the one we perceive at home is in a parked car underneath the
400 kV power grids. I speculate that
eddy currents are induced in the various parts of the car body and chassis
which vibrate rather like an EMAT in ‘speaker’ like manner accordingly. Using a laptop with spectrum lab one is able
to capture spectra under power lines very similar to the one of Y1 above. For clarity,
I should point out that the noise perceived is not corona noise. I should also point out that it is not
always possible to perceive the Hum in this manner. Just as it comes and goes at the author’s
location, it also comes and goes under power lines. It seems to depend on precise ratios of
sub-harmonic and harmonic content present and whether or not the amplitudes are
fluctuating. Modern power systems with
Smart Grid Control, solid state DC links and the like are on occasion known to
exhibit parametric instability [33].
This links back to the idea of sub-stations. I ask,
could the Hum in people’s houses be a combination of ground borne acoustic
signals (vibrations) from such sub-stations accentuated by coherent arrivals of
strong ground currents exciting the loudspeaker effect in walls? Some time ago I was asked to assist a
resident in Charlbury who was
eventually drive out of her home by the
Hum. Nestling in the Evenlode Valley, sequestered down winding B roads but with
its own railway station, Charlbury is a vibrant yet picturesque Oxfordshire
town. The local council supplied acoustic spectra recorded outside two nearby
substations and in her home. Most of the
frequencies present at the sub –stations were also present at the home. What they could never account
for was the lack of attenuation.
The notion of ‘walls have mouths’ together with the newly discovered
architectural speaker discovered here goes a considerable way to clarifying the
matter and very interestingly indeed many of the frequencies observed for the
Charlbury Hum have also been observed in the author’s house.
Is the Hum getting more intense or is something
sensitizing more people to the Hum?
Certainly, as far as the UK
is concerned there do seem to be more Hum reports of late. Most of Britain now
uses the PME earth system and most houses in Britain have double glazing. The only infra-structure that has continued
to grow almost unchecked of late has been renewable energy infrastructure
especially wind-farms. For the Hum at
the author’s house it seems that airborne infrasound provides components found
both at the façade and on the inside of the window and house whereas the wall
‘loudspeaker’ provides the rest of the frequencies. The Hum levels at the author’s house depend
strongly on wind-speed and direction a pointer that the local wind-farms may be
involved. Wind energy also causes
frequency instability [34] and
flicker [35] on the mains
electricity supply and additionally phase imbalances which need SVC
compensation [36]. Potentially
thus it is feasible that wind energy alone is, although not the sole cause of
the Hum noise, a highly contentious catalyst for its increase in both
prevalence and intensity especially as there will be a quasi- coherence between
the airborne acoustic signals from the turbines and the sounds arising
from the newly discovered ‘speaker’ in
our house walls .
There are a few anecdotal
reports of deaf and partially deaf people perceiving the Hum. There are reports that people can get relief from
the Hum by going into deep underground limestone caves but not copper bearing
caves. In those cases, one must perhaps
retain the possibly of low frequency electro- magnetic perception an area where
the science is lacking and more work needs to be done.
Further work: we know what but do we know where?
OK, so we now know what the Hum is and we also know what
makes it different from other LFN’s.
In summary for Hum in the author’s house infrasound
below 20 Hz, and some pulsating acoustic emissions at mains related frequencies
are required together with subharmonics and possibly harmonics. The Hum is strongest when there is an
apparent ‘comb’ with a 10 Hz gap. This
appeared to be the same or very similar to the case of the Hum in
Charlbury. It seems that in certain
locations the walls of houses can produce these frequencies by acting as
piezo-electric or magnetic loudspeakers or both. It seems this is not simply a ground
vibration phenomenon because there are few if any Hum reports from parts of the
world which do not have PME electrical earth systems. Thus some of these frequencies appear to be
‘induced’ by strong electrical ground currents which usually appear at
night.
At least in the author’s house the Hum is heard to
physically switch on, usually between 10 and 11 pm although very occasionally
it has been heard in the daytime as well, especially at weekends. The author lives in Gwynedd, North
Wales. Recently there have been Newspaper
reports of a Hum which ‘switches on’
every half hour or so throughout the night from Welsh locations as far apart as
Cefn y Bedd, Llay, Deganwy and Llandudno.
National Grid have investigated this Hum and found frequency components
of 40 and 50 Hz yet state that they cannot identify the source [37]. These frequencies have also been found
in Hum observation ‘Y6’ in the present work and in the ground current spectra
of the present work.
Both
are feasible and both now warrant further and urgent investigation. MacPherson has been investigating the
famous Windsor Hum. In 2011, the Zug Island area was identified
by Canadian scientists and Ontario's Ministry of Natural Resources as the
source of mysterious rumblings and vibrations, known as "The Hum",
that have plagued hundreds of area residents with cyclical vibrations
reportedly being felt in the ground up to fifty miles. He has suggested Electrical Blast Furnaces as
a culprit. These are known to cause
enormous harmonic instability in electricity supplies.
At
a local level it is feasible that any equipment operating on time switches
could impact phase balance and earth currents, for example this could be loads
such as; economy 7 heating systems,
overnight water and sewage pumping and the like.
At
a National level, our pumped storage
power stations usually start to pump water up to their upper reservoirs at
about 11pm. Moreover, more of the load
on the power grid is now controlled in a digital manner via the Smart
Grid.
At
the author’s house there are potential pointers for both above. For example, he has shown that the Hum
intensity varies considerably depending
which specific motor generator ‘pairs’ are pumping water up to the top
reservoir lake at the Dinorwig Pumped Storage
Power Plant.
More
locally, the times of the Hum seem to follow a sinusoidal pattern in line with
the local coastal tides with the Hum maximizing at periods about halfway
between high and low tides. The author
believes there are two possible
explanations for this. Firstly, tides
effect stresses within the earth itself and can change seismic propagation. Secondly,
Bangor has a sewage discharge
point which possibly would pump its outflow at such times. Although according to the following
reference, most sewage is discharged between 9-10 am and 6-7 pm. Smaller discharges at other times are possible [38].
Tidal
effects are also known to change ground water flow which could impact on ground
electrical currents. In the author’s
home area the Menai Strait is a tidal strait which could potentially influence
stray ground current flow between the mainland and the Island of Anglesey.
Interestingly,
all of the above might not only impact power frequency and quality but also
associated ground borne vibrations as well.
Certainly, in the complex soundscape we live in, ground borne vibrations
from any of the other utilities might not be ruled out. The author has contacted the water
utility company and has been advised that water in his area is gravity fed
rather than pumped. The author’s own study
of other utilities suggests that at least in his residence they are not the
cause of the Hum, although the gas grid could conceivably supply a signal at 36
Hz [39].
For completeness, the author now proposes
to make a subsidiary study of the sewage system!
The
author has come a considerable way along the path to super-sleuthing the Hum
but perhaps a little more remains to be
done. It is hoped this article will act
as a catalyst for others to make their own measurements and enquiries, so that once and for all the world will have
a solution to the enigmatic ‘far more than just a noise’ problem which is the
Hum.
References
1.
Moller
and Pedersen (2004), http://www.noiseandhealth.org/article.asp?issn=1463-1741;year=2004;volume=6;issue=23;spage=37;epage=57;aulast=Moller
2.
Salt and Hullar ( 2010) https://www.ncbi.nlm.nih.gov/pmc/articles/PMC2923251/
3.
Leventhall
(2004) http://www.noiseandhealth.org/article.asp?issn=1463-1741;year=2004;volume=6;issue=23;spage=59;epage=72;aulast=Leventhall
4.
Branco
and Alves-Pereira (2004) https://pubmed.ncbi.nlm.nih.gov/15273020/
5.
Deming
(2004) https://citeseerx.ist.psu.edu/viewdoc/download?doi=10.1.1.518.9056&rep=rep1&type=pdf
6.
Frosch (2013)
https://www.brummton.info/wp-content/uploads/2020/02/1304.pdf
7.
Rushford
et al ( 1999) https://journals.sagepub.com/doi/abs/10.1177/026309239901800302
8.
Leventhall
(2000) https://journals.sagepub.com/doi/pdf/10.1260/0263092001492859
9.
Montago
and Gushika Uesu (2019) https://www.ingentaconnect.com/contentone/ince/incecp/2019/00000259/00000005/art00036
10. Salt and Lichtenhan (2104) file:///C:/Users/CHRIST~1/AppData/Local/Temp/Salt-Lichtenhan-How-Does-Wind-Turbine-Noise-Affect-People.pdf
11. Fox (1992) https://www.newscientist.com/article/mg13518321-000-factories-and-traffic-blamed-for-the-hum-/?ignored=irrelevant
13. Broner (2010) https://www.researchgate.net/publication/239006363_A_Simple_Criterion_for_Low_Frequency_Noise_Emission_Assessment
14. Leventhall (2003) https://www.researchgate.net/publication/237245317_A_Review_of_Published_Research_on_Low_Frequency_Noise_and_its_Effects
15. Ground Vibration Engineering: Simplified Analyses with
Case Studies and Examples by Milutin Srbulov,
Google Books. https://books.google.co.uk/books?hl=en&lr=&id=VnrcZxkvy3wC&oi=fnd&pg=PR5&dq=15.%09Ground+Vibration+Engineering:+Simplified+Analyses+with+Case+Studies+and+Examples+&ots=4YnlkkE2w_&sig=_Mn-b35dy_mCvmN9zuUKf4PSsYQ&redir_esc=y#v=onepage&q=15.%09Ground%20Vibration%20Engineering%3A%20Simplified%20Analyses%20with%20Case%20Studies%20and%20Examples&f=false
16. Cowan (2008) http://www.icben.org/2008/PDFs/Cowan.pdf
17. C.X. Wang et al., “Transduction of the geomagnetic
field as evidenced from alpha-band activity in the human brain,” eNeuro,
doi:10.1523/ENEURO.0483-18.2019, 2019. https://www.eneuro.org/content/6/2/ENEURO.0483-18.2019
18. https://www.qsl.net/dl4yhf/spectra1.html
19. https://bobbyowsinskiblog.com/2018/11/14/build-subkick/
20. John Dawes, Twitter Pages, https://twitter.com/gridsick
21. Papargyris et al (2001) https://www.sciencedirect.com/science/article/abs/pii/S0950061801000071
24. http://vincent.burel.free.fr/download/index.htm
25. Gorga et al (2007),
https://www.ncbi.nlm.nih.gov/pmc/articles/PMC2440918/
26. https://journals.sagepub.com/doi/pdf/10.1260/026309205775374451.
27. https://www.wind-watch.org/documents/wind-turbine-noise-propagation-below-100-hz/.
28. Power transformer acoustic spectra: https://www.tdworld.com/grid-innovations/article/20964143/the-quiet-life.
29. https://www.spenergynetworks.co.uk/userfiles/file/EART-01-002.pdf.
31. http://wiki.diyfaq.org.uk/index.php/Earthing_Types
33. Mohamed (2010) https://ieeexplore.ieee.org/document/5559482
34. file:///C:/Users/docto/Downloads/Nguyen_grad.msu_0128D_15469.pdf
35. Moreno et al (2002)
https://ieeexplore.ieee.org/abstract/document/1009479
36. https://ieeexplore.ieee.org/abstract/document/6244445
37. https://www.dailypost.co.uk/news/north-wales-news/national-grid-find-mystery-humming-18615748
38. http://www.marinet.org.uk/campaign-article/sand-sea-and-sewage
39. http://www.drchrisbarnes.co.uk/UTILITY.htm