‘QBO a new method of predicting UK weather trends’ by Dr Chris Barnes, Bangor Scientific Consultants e-mail doctor.barnes@yahoo.co.uk
Dr Barnes Homepage http://www.drchrisbarnes.co.uk
Abstract
The QBO and its relationship with the discovery of the equatorial zonal winds is described. QBO is known to affect Atlantic storminess (ref), perhaps of particular interest for winter 2013/14. QBO has been shown to influence the magneto-acoustic phenomenon known as the Hum which has been used for medium term weather prediction in Wales (Barnes 2013). QBO is known to affect the aerosol loading of the atmosphere (ref) and may be of particular interest to the behaviour of aircraft contrails and climate (refs). More reason still then why we should explore QBO. Highly detailed association of weather anomalies with QBO, have,it is believed for the first time ever, been examined here. An advanced regression model ( patent applied for) has been developed which predicts for 2014 411% of February rainfall based on averages for the period 1961-1990. This is more or less exactly what is happening at present. Since QBO phase reversals are still not fully understood, it is not wholly possible to ascribe the present values to climate change be it of solar or anthropogenic origin. Some have argued that the recent winter storms are unique. This is, in fact, not the case. The January February Periods of 1979 and 2009 which had similar but QBO PHASE and a winter storm swept across the south of England on 9–10 February 2009 bringing heavy rain and snow, which caused flooding in southern England. Another example, with a similar QBO phase and amplitude predating the notorious ‘hockey stick’ is the flooding in December 1965 when much of Worcester was under water and the river Severn was some 5 metres above its normal level. Those who simply equate extreme weather with CO2 driven climate change should also be informed that historic great floods occurred prior to Maunder and Dalton Minima. Recent behaviour of the sun strongly suggests we may be heading towards one of these scenarios.
Introduction
With some suggesting that extreme weather events are becoming more of a feature in the UK there is an urgent need to develop new predictive methods. This paper starts to address such a need.
The massive eruption of Krakatau volcano in 1883 led people to believe that the equatorial stratospheric winds blew in a westward direction. This was based on the direction and arrival time of dust from the eruption. The winds became known as the Krakatau Easterlies. However, in 1902, Berson using weather balloons above Lake Victoria in Africa found Westerly winds at 15km height, so called Berson’s Westerlies, see Assmann and Berson (1902) [1].
These conflicting results were resolved in 1961 by the independent discoveries of Reed (1961) [2] and Veryard and Edbon (1961) [3] both of whom deduced that the equatorial winds oscillate in the E/W direction with a period of approximately 26 months and descend in height with time, the phenomenon being known as the Quasi-biennial oscillation (QBO for short).
Gabis (2012) [4] has stated that the QBO of the tropical latitudes has also a significant influence on processes at middle and even higher latitudes. The World’s weather and climate systems are of course incredibly complex, multivariate systems, see for example but not exclusively Steinschneider and Brown (2013) [5]. Such systems have forcing, couplings and feedbacks the understanding of which is permanently being refined, see for example, Dora Pancheva (2007) [6]. Traditionally, forcing of the thermosphere is regarded as by gravity waves and infrasound from below and by solar radiation, solar wind and GRB from above, see Otashev et al (2005) and Lastovika 2009 [7] and I have suggested AGW/infrasound flow is a two way street, see Barnes (2013) [8]. The fact that two way pressure changes can be detected at ground level during a solar eclipse, see Jiniai et al and Marty et al (2013) [9] is excellent support of my hypothesis. Thus in my opinion AGWS associated with the phased descent of QBO ought to be either in themselves either a major driver or indicator of climate or both.
Gabis has suggested it should be possible to accurately forecast the QBO [4] and has observed a 30 month periodicity. Some have suggested its period is strictly limited to 18, 24 or 30 months (hence the 26 month average over time), see for example Tian et al (2006) [10]. Presumably these values are related to coupling involving the semi –annual (arctic oscillation). However, close inspection of the NOAA data from 1979 to the present for the 50 mb zonal wind suggest this not always to be the case. I would suggest here that this discrepancy may be because of a number of factors such as solar geomagnetic coupling effects and Ap out of phase with sunspot effects (Luhmann 2007[11]), sun-earth inertial gravity effects and anthropogenic gravity wave coupling due to large wind farms and the like. The need to incorporate Orographic GW effects in GCM models was first recognised by McFarlane (1987) [12]. I hypothesise that large wind farms will act rather like mountain ranges and need to be treated accordingly. Roy and Tratuer 2010 [13] stated that utility-scale large wind farms are rapidly growing in size and numbers all over the world. Data from a meteorological field campaign show that such wind farms can significantly affect near-surface air temperatures. Satellites have even been used to visualise the wake effects of large wind farms, see Chrisitan and Hasager 2005 and 2013 [14]. Barrie and Kirk-Davidoff (2010) [15] actually show that wind farms in the USA could both alter surface roughness induced atmospheric forcing, exactly in line with my present hypothesis and significantly alter the track of cyclones across the Atlantic. Adams and Kieth 2007 [16] have attempted a climate parameterization model on wind farms accordingly. The QBO also influences the world distribution of stratospheric pollutants and gases including CO2. There are very large number papers on this topic.
QBO as a weather trend predictor, methodology.
QBO is known to affect
Atlantic storminess, see for example, but not exclusively, the Comet Programme,
Chapter 4 [17].
Then perhaps of particular interest would be the winter of 2013/14. I have also shown QBO to influence/be related
to the the magneto-acoustic phenomenon
known as the Hum which has been used for medium term weather prediction in
Wales [18]
QBO is known to affect the aerosol loading of the atmosphere , see Abish (2012) [19] and now confirmed by Hommel et al (2014) [20]and may be of particular interest to the behaviour of aircraft contrails and climate to which there are vast numbers of references far too huge to cite here and very little agreement*. I too have visited this realm and I would simply refer the reader to my website in general [21]. *More reason still then why we should explore QBO.
As far as I am aware, highly detailed association of
weather anomalies with QBO, have never
been considered or sought after.
Perhaps then it is time to enquire if QBO could be used predicatively for weather trends?
An example linear regression plot is shown in figure 1 below.
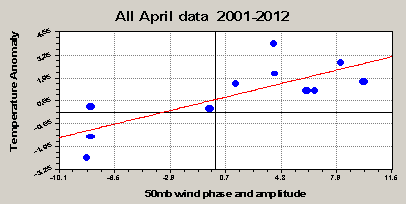
Figure 1.
The linear regressed slopes ( temperature anamoly/ QBO) of all 12 months of the year are plotted in figure 2.
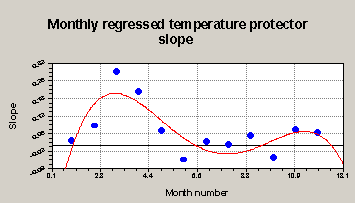
Figure 2
It can be seen from figure 2 that, across an entire solar cycle, QBO only strongly influences UK temperatures in March and April. Minimum influence occurs in the summer months with a secondary, lesser, peak of influence occurring in November and December. In June and September the phase of QBO influence, although weak would appear to be reversed. The annual cycle of changes here is similar to that observed elsewhere for the Hum (http://www.drchrisbarnes.co.uk/Forecast.html) [22] and may be related to the annual variation in arctic cloudiness , see Curry and Ebert 1992 [23]. The best fit to figure 2 is, however, a fourth order polynomial equation. Clearly there may be more at play here than just arctic cloudiness or the semi-annual oscillation.
A similar treatment has been made for rainfall anomaly. An example of an individual monthly plot is given in Figure 3.
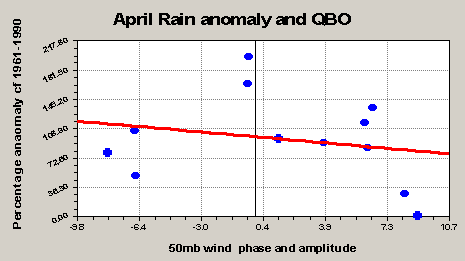
Figure 3
Individual monthly linear regression plots are all different and unique but in order to avoid creating excessive clutter in this publication they have not all been included here. The slopes form each plot have been collated in Figure 4.
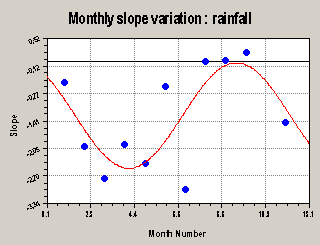
Figure 4
Figure 4 is a sinusoidal fit to the data. The sinusoidal shape is characteristic of the semi-annual oscillation. Again the QBO would appear to have maximum sphere of influence in the spring months of February, March and April and the phase is opposite in effect for rainfall anomaly as it is for temperature. Naturally based on cloud albedo this is exactly as to be expected. QBO would also appear to have a significant influence on UK ( North Wales) rainfall in November.
Prediction
The only way to test the QBO method is by prediction within the present solar cycle and for the remaining part of 2014. The present phase of the QBO could continue for another 1 or 2 years. Based on this the prediction is a substantial reduction in rainfall from March to May 2014, with above average temperatures in March and April.
If the QBO phase changes an online forecast change will appear on the author’s webpage.
When the QBO does change phase again in 2015 or 2016, this combined with much lower solar Ap values might possibly lead towards a Dalton minimum.
Present situation (February 2014)
A much more advance regression model has now been developed and a UK Patent Application filed. Therefore details of the method and algorithms are not published here but disclosure can be made to interested parties under protection of a NDA. However, in the advanced model for a Westerly QBO at appropriate zonal wind speeds this February 's excessive UK rainfall is correctly predicted.
Both models predict a very dry April and given what is happening to Britain at present let us hope their prediction is correct.
The present situation of exceptionally enhanced rainfall is not directly apparent from the linear regressed monthly model for Winter 2013/14. One general form of output from the advanced polynomial model for the months of February and March and April are shown below:
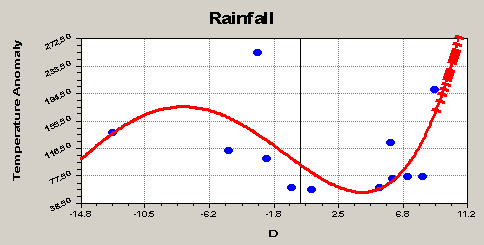
Figure 5 January excess rainfall and QBO phase/amplitude
The model predicts elegantly the excessive rainfall experienced in January 2014.
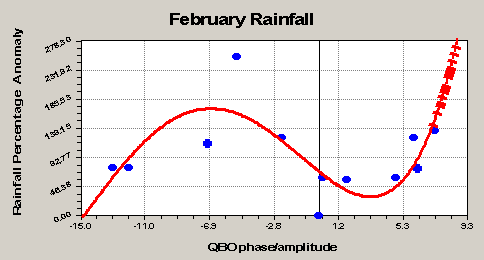
Figure 6 February excess rainfall
For a 50 mb QBO index approaching 10, the model predicts an astounding 411% of February rainfall . This is more or less exactly what is happening at present!
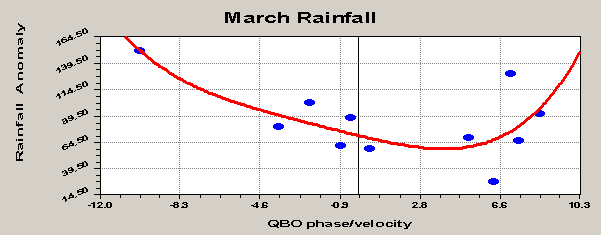
Figure 7 March rainfall anomaly versus QBO phase/velocity
By the way of prediction, the March analysis shows some sign of light at the end of the tunnel. Based on the model, and by feeding in the last reported zonal wind data, March rainfall will be about 130% of normal compared with the period 1961-1990. But, a note of caution is needed here. The fastest positive phase 50mb zonal wind recorded since 1979 is 12.44 m/s. If this scenario were to be repeated there would be 260% of normal March Rainfall.
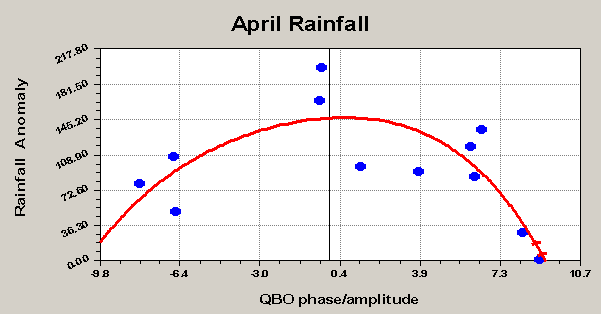
Figure 8 : April Rainfall Anomaly
The model also predicts an exceptionally dry April which should finally allow the drying out of the presently flooded areas.
Conclusion
It would appear that UK rainfall anomaly can very elegantly be predicted by the method developed ( patent applied for).
Since QBO phase reversals are still not fully understood, it is not wholly possible to ascribe the present values exclusively to climate change, be it of solar or anthropogenic origin or a mix.
Some have argued that the recent winter storms are unique and are a facet of carbon driven warming. This is, in fact, clearly not the case and can be illustrated as follows: The January February Periods of 1979 and 2009 which had similar but QBO PHASE but with not quite such extreme amplitudes as today and thus it is wholly relevant to note that a winter storm swept across the south of England on 9–10 February 2009 bringing heavy rain and snow, which caused flooding in southern England. Perhaps the most important other example, with a similar QBO phase and amplitude pre-dating the notorious ‘hockey stick’ is the flooding in December 1965 when much of Worcester was under water and the river Severn was some 5 metres above its normal level.
Those who simply equate extreme weather with CO2 driven climate change should also be informed that great floods of historic magnitude and notoriety occurred prior to both previous Maunder and Dalton Minima. Recent behaviour of the sun in terms of falling Ap strongly suggests we may be heading towards one of these scenarios.
The present hypothesis has been supported by the model developed, the predictions it has made and is making and the support from past events.
Further work
It is proposed to comprehensively develop the model to take into account temperature and sunshine anomaly and gales recorded at the home of the author and also to explore the effect of QBO on or its relationship with persistent contrails which have been shown to have been of crucial importance in Wales (http://www.drchrisbarnes.co.uk/TEMJET.htm) [24]. For instance at the times of the contrail data in reference 24, the QBO phase was +ve and its June amplitude was between about 5 and 7. Also the model will be refined to predict both long and sporadic short periods of extreme weather and its probability.
References
1.
Ergebnisse der Arbeiten am Aeronautischen Observatorium [i. d. J. 1900-1902]
2.
Evidence of a
downward-propagating, annual wind reversal in the equatorial stratosphere
http://onlinelibrary.wiley.com/doi/10.1029/JZ066i003p00813/abstract
3.
Veryard, R.G. and R.A.Ebdon, 1961: Fluctuations in tropical stratospheric
winds.
The Meteorological magazine Vol. 90, pp. 125-143.
4.
http://adsabs.harvard.edu/abs/2012JASTP..80...79G
5.
http://onlinelibrary.wiley.com/doi/10.1002/wrcr.20528/abstract
6.
http://www.researchgate.net/profile/Dora_Pancheva2/publications
7.
Lastovicka, J. (2009),
Lower ionosphere response to external forcing: A briefeview,Adv.
Space Res.43, 1
8.
Global
Climate Change, natural, inadvertent and planned controls some unsung concepts. By Dr Chris Barnes, Bangor Scientific and Educational
Consultants. E-mail scienceconsultants@yahoo.co.uk http://www.drchrisbarnes.co.uk/Global.htm
9.
http://journals.ametsoc.org/doi/abs/10.1175/JAS-D-12-091.1
10.
http://onlinelibrary.wiley.com/doi/10.1029/2005JD006871/pdf
11.
http://www.aas.org/cswa/MAY07/SPD07inv.pdf
12.
http://journals.ametsoc.org/doi/abs/10.1175/1520-0469%281987%29044%3C1775:TEOOEG%3E2.0.CO;2
13.
http://www.pnas.org/content/107/42/17899.abstract
14.
Wind Farm Wake: The
Horns Rev Photo Case, Energies 2013, 6,
696-716; doi:10.3390/en6020696
15.
http://www.atmos-chem-phys.net/10/769/2010/acp-10-769-2010.pdf
16.
http://adsabs.harvard.edu/abs/2007AGUFM.B44B..08A
17.
http://www.goes-r.gov/users/comet/tropical/textbook_2nd_edition/navmenu.php_tab_5_page_2.2.0.htm
18.
http://www.drchrisbarnes.co.uk/SOLARMAG.htm
19.
QBO is known to affect the aerosol loading
of the atmosphere, shodhganga.inflibnet.ac.in:8080/jspui/bitstream/.../11_chapter%204.pdfby B Abish - 2012
20.
http://www.atmos-chem-phys-discuss.net/14/16243/2014/acpd-14-16243-2014.html
21.
http://drchrisbarnes.co.uk
22.
http://www.drchrisbarnes.co.uk/Forecast.html
23.
http://www.curry.eas.gatech.edu/currydoc/Curry_JC5.pdf
24.
http://www.drchrisbarnes.co.uk/TEMJET.htm