Why climate models fail and why we do not need Net Zero by Dr Chris Barnes Bangor Scientific and Educational Consultants. Wales UK, LL57 2TW. email manager@bsec_wales.co.uk First published online 10th February 2025.
Abstract
Climate
models are shown to be inadequate based on:
1. Incorrect
assumptions. CO2 is shown not to be the main driver. CO2 alone is only responsible for a tiny 20 milli-Kelvin of warning since those emissions began.
2. Incorrect input data. UHI errors and
even made-up data have been entered.
3. Lack of parameters. Over a dozen different modes of coupling and
feedback are missing. Clouds and contrails are very poorly
represented. Material transport is highly relevant. A basic understanding of elementary
polynomial equations is all that is needed to appreciate that any missing higher order parameter can completely alter
an outcome.
4.
The conclusion is reached that Net Zero is not required.
5.
However, we should transmit AC electricity with caution due to its effect on
energetic particle precipitation and
hence cloud formation on earth.
6.
Because the atmospheric lapse rate is fixed essentially by pressure and
gravitation place with high ‘UHI’ ( actually more properly defined as ‘waste
heat’) will continue to warm.
7. Efforts for exciting new technologies ought to be directed towards
remediation of 5+6 above not ‘green’
energy which still creates heat and not CO2 removal, which is irrelevant and
futile.
Introduction
Not a single day passes when we do
not hear the term ‘climate change’ or
‘carbon emissions’ in the
news media not once or twice but often
dozens or even hundreds of times. It
even features in nature programs and
even soap operas! The simple triatomic gas carbon dioxide gets
blamed for almost all the world’s ills
these days from global heating ( of late
we have the UN’s new phrase global boiling)
to global cooling, ice ages
forthcoming, AMOC collapse, strong winds, heavy rains,
hurricanes, tornadoes, you name it.
We are told things like ‘the science
is settled’ , do not question us. The
IPCC knows best etc. etc. They are
aided by the WMO who have recently defined a climate
epoch as
a mere 30 years, a value less
than the estimated duration of one of the world’s most important oceanic
climate cycles the AMO ( Atlantic
Multidecadal Oscillation). The
latest IPCC models foretell absolute gloom
with up to 6-8 C of heating in the next 100 years or so and about 2C of heating by 2050. Yet when we look at the figures in more detail,
we see there have been multiple hiatuses
in heating since 1850 and an
average global heating is now happening at about a third of the rate that these models
predict.
Clearly despite the phenomenal investment in both people and
computational power, these climate models are failing and failing
miserably. Yet the world and in
particular western politicians keep up an almost insane and some would say
pseudo religious belief in their predictions and the latter shout and virtue
signal about how they will
simultaneously avert impending worldwide disaster while making mega-bucks on the back of
‘green’ energy technologies. In
the meantime, ordinary people, particularly in Britan pay the price in huge
taxes and energy bills as our traditional energy sources have been dismantled
and destroyed. Moreover they have now
made moves likely to destroy our farming industry and food security to
boot.
But what if? What if they got it
all terribly, terribly wrong? We
know the climate models are failing, and we
need to know why.
I have listed the ‘obvious’ problems
below and will proceed to examine each in more detail.
1. Incorrect assumptions. CO2 not the main
driver.
2. Incorrect input data. UHI errors and
even made-up data have been entered.
3.
Lack of parameters. Over a dozen different
modes of coupling and feedback are missing.
Assumptions
The main assumption of all climate
models is that CO2 is the primary driver of climate because it ‘traps heat. The so-called Greenhouse Effect’. In the late 19th century, scientists first
argued that human emissions of greenhouse gases might be able to change Earth's
energy balance and climate.
John Tyndall was the first to
measure the infrared absorption and emission of various gases and vapors. Tyndal’s experiment :
From 1859 onwards, he showed that
the effect was due to a very small proportion of the atmosphere, with the main
gases having no effect, and was largely due to water vapor, though small
percentages of hydrocarbons and carbon dioxide had a significant effect.
The wording is highly
instructive. Tyndall showed that so-called
Greenhouse gases absorb infra-red heat but also re-emit it. The heat ‘trapping’ observed in such said
experiments is expressed as a warming of
a fixed tube or container. The
container warms because as the molecules relax, having additional degrees of
freedom they also increase their mean speed and collide with the container
walls causing heat and pressure.
The effect was more fully quantified
by Svante Arrhenius in 1896, who made the first quantitative prediction of
global warming due to a hypothetical doubling of atmospheric carbon dioxide. Such experiments and predictions were made on
pure gases in sealed containers. Heat resonates molecules, then leaves quickly and adds to overall
kinetic energy, increased pressure and striking of and warming of container
walls.
The fact remains that the earth’s
atmosphere is not a closed container and
does not contain a pure gas either. The
heat is not trapped per se, in the earth’s atmosphere it is merely delayed and
then re-emitted by I/R resonance at minute timescales. Moreover, collisions with other gas molecules
distort them through Van der Waal’s interactions and allow Black Body type radiation and hence more of an
all sky emission to occur.
Moreover, CO2 only absorbs and re-emits Infra Red over narrow sharp bands
most of which are overlapped by the
broader absorption bands water. Only
a narrow portion of the earth’s atmosphere actually absorbs
and re-emits at an effective emission height which moves higher with increasing
CO2 concentration. This has been
elegantly described by Clive Best,
see https://clivebest.com/blog/?p=4475[1] and figure 1 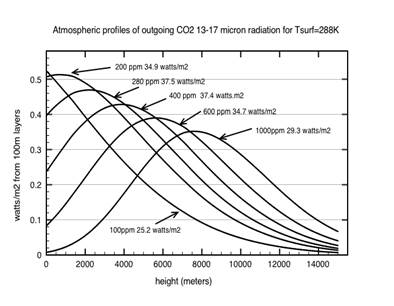
Figure 1: Radiation
flux height profiles for 100m wide layer due to CO2 molecules at different
concentrations. All profiles are calculated for Ts=288K and lapse rate =
6.5K/km. The numbers correspond to total atmospheric outgoing radiation flux.
The most relevant
I/R band for CO2 is the 15 micron band.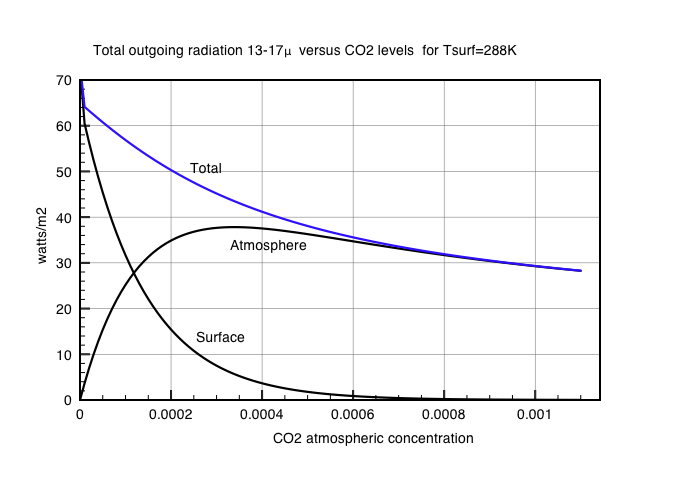
Figure 2.
Best has also shown that the peak
for atmospheric OLR occurs for ~ 300ppm which just happens to be that found on
Earth naturally. Can this really be just a coincidence? It is almost as if
convection and evaporation act to generate a lapse rate which maximizes
radiation cooling by CO2 to space. If this conjecture is true in general, then
any surface warming due to a doubling of CO2 levels would be offset somewhat by
a change in the average environmental lapse rate to restore the radiation
losses in the main CO2 band. In this case the surface temperature would hardly
change at all.
In any event the above is only very relevant under clear sky conditions and without wind. With wind,
most heat moves in the atmosphere by convection and with cloud water vapor absorption and cloud
reflections dominate by
orders of magnitude! The classic
test is to walk out in a T-shirt on a warm sunny day and note the change in
perceived heat on one’s arms when a
cloud cover’s the sun. The air temperature of course lags
dramatically. A cloudless earth, according to NASA could be up to 12 C
warmer than today’s values.
See https://isccp.giss.nasa.gov/role.html [2]
I will return to the question of clouds later in this paper
when I discuss Net Zero and fuel security.
The upshot of the author’s theory
and that of Best is that CO2 as the main driver is hugely over egged. The question to be asked is there any more
support for this in the scientific literature?
Indeed such evidence does
exist. Smirnov ( 2019) [3]
suggests that industrial CO2 alone is only responsible for a tiny 20
milli-Kelvin of warning since those emissions began. Indeed it would
seem CO2 is only a minor driver of change if a driver at all.
Best has described the issue of
lapse rate as a function of convection and evaporation and
radiative cooling by CO2. But what if an alternative ( equivalent)
explanation were valid. Take Mars and Venus for example. Both planets have atmospheres of almost pure CO2. Venus is
searingly hot whereas Mars has
temperatures which vary between about
15C in summer and over 100C sub zero at its poles in
Winter. Granted these two planets have
different solar insolation. Arguably
does Venus have insolation at all? With and atmospheric pressure of 92 BAR and a near molten surface due to internal
heat. Recently, Nikolov and Zeller have addressed this
conundrum. Their work Nikolov
and Zeller, (2017) [4] https://www.researchgate.net/publication/317570648_New_Insights_on_the_Physical_Nature_of_the_Atmospheric_Greenhouse_Effect_Deduced_from_an_Empirical_Planetary_Temperature_Model
is suggestive of a fixed
adiabatic lapse rate independent
of atmospheric composition,
and is very importantly confirmed by their
2022 paper Ned Nikolov & Karl
Zeller: Exact Calculations of Climate Sensitivities Reveal the True Cause of
Recent Warming – Iowa Climate Science Education May 2022.
[5] In this latter paper they examine satellite readings of OLR and surface temperature and show
that heat trapping per se according to GHG warming theory does not happen!
2. Incorrect starting data
Having shown that CO2 is not really
a player, it is almost academic to discuss ‘starting data’. However, one still has to
ask how on earth could these models be
yielding anything at all? The answer would seem to be in a trap that we have all fallen into from time to
time. That is ‘correlation is not
necessarily causation’ It would appear another
factor(s) may be pushing up global temperatures which co-correlate(s) with CO2 in some way.
Best’s work [1] suggests
CO2 ( if it has an effect at all) to be either saturated or almost
saturated. Yet global temperatures and model outputs driven
by ever increasing inputs have recently been rising more steeply. How on earth could we reconcile
this? It has recently been shown
that 28% of all earth climate stations are in regions with very high UHI. Moreover, the present author has shown these
temperature station figures to be further
aggravated by waste heat [6].
Feeding this data into climate models will be bound to skew their
outputs. As if this were not bad enough
on its own, in November 2024 it was
revealed that shocking evidence has emerged that points
to the U.K. Met Office inventing temperature data from over 100 non-existent
weather stations. The explosive allegations have been made by citizen
journalist Ray Sanders [7] and
sent to the new Labour Science Minister Peter Kyle
MP.
3. Lack of Parameters/Incorrect
Parameters/ Underestimated Parameters
The earth climate
system is an incredibly complex multivariate and stochastic system involving every level of lithosphere ( solid
earth and oceans) and atmosphere, and
solar and space inputs. The earth is thermodynamically unique and does not fall neatly into any of the
standard thermodynamic system descriptions despite what school
books and even university texts might state. Earth system models (ESMs) and regional climate models (RCMs) produce over a hundred variables
describing changes in the climate
system. Many of
these variables, however, can behave very differently from one model to the
next, particularly those calculated in full or in part based on the physical parameterizations.
To better understand the behaviour of
these climate variables, let’s take a look at the
physical parameterizations of a climate model.
Physical climate models, such as ESMs and RCMs, have to solve the fundamental equations of fluid mechanics,
which govern atmospheric and ocean circulation, transposed onto
three-dimensional calculation grids. The horizontal resolution defines the spacing between the points of the calculation
grid. In the jargon of climate and weather
modelling, the processes described by the fundamental equations that are
compatible with the size of the grid are said to be resolved and part of the
model dynamics. However, a host of climate-relevant phenomena occur on a scale
too fine for the calculation grid, so they cannot be handled by the fundamental
equations. These unresolved processes must nevertheless be included in the
model, as they have effects at the grid size scale. Neglecting them would imply
an unrealistic simplification of the Earth’s climate. Each phenomenon must
therefore be parameterized, i.e. represented by empirical relationships.
The physical parameters of existing
climate models contain significant, but not all relevant, families of processes, including:
·
ultraviolet
and infrared radiation transfers,
·
cloud
formation schemes,
·
the
microphysics of precipitation formation in clouds,
·
deep
convection responsible for tropical storms,
·
surface
schemes for atmosphere-soil-vegetation exchanges,
·
photochemistry,
Clouds and contrails
poorly represented
From the above list
clouds are actually the least understood and the least
properly represented. Over more than
half a lifetime’s observation the present author can
state with certainty that he has observed huge alterations in Britain’s
cloudscapes which appear to be mirrored around the world. Again,
purely from personal observation it would appear that
aviation and particularly aviation since circa 2000 is causing such
changes. A secondary notion is that
there is also some connection with wind farms and wind energy, see for
example drchrisbarnes.co.uk/WFCON1.HTM (2014). [8]
The persistent
contrails caused by aviation can have phenomenal effects on local weather and hence over longer timescales also climate.
The author has reviewed effects of aviation elsewhere, see http://www.drchrisbarnes.co.uk/AVICON.htm [9]. Since clouds can provide over an order of
magnitude times the alleged change
in albedo due to CO2 it seems ludicrous to have models with them so ill-
parameterized.
There is a huge volume
of literature on contrails and persistent contrails yet they are the least
understood of clouds, ACP -
Sensitivity of cirrus and contrail radiative effect on cloud microphysical and
environmental parameters , Wolf and Boucher (2023 ) [10].
An especially
overlooked feature is that persistent contrails tend to scavenge water from the atmosphere and hence have the
potential to alter clouds at all levels.
Computed contrail cirrus properties
compare reasonably with theoretical concepts and observations. The mass of
water in aged contrails may exceed by a staggering 106 times
the mass of water emitted from aircraft, see Schumann et al (2015) [11].
Windfarms
too are known to cause significant changes in the distribution of rainfall and
clouds. Wang and Prinn (2010) [12]. Using wind turbines to meet 10% or more of
global energy demand in 2100, could cause surface warming exceeding 1 °C over land installations.
The
present author has experimented with mathematical manipulation main elements of
the non -linear climate such as temperature and rainfall. Such
systems can be represented by polynomial equations. It is a well-known feature of a polynomial
that if any of its higher order parameters are in error, even slightly, this
can drive the whole result wildly out eve
to the point f changing arithmetic sign and hence in
climatic terms albedo direction. The
same, of course, could be potentially true for simply missing out any higher
order parameters completely.
Material
Transfers.
Although present models consider some aspects of material transfer such as troposphere to stratosphere movement during deep convection, the atmosphere has other facets such as meteor influx and solar particle influx and gaseous outflux to space which are simply not considered. This is somewhat ironic given that the whole science of meteorology actually began, historically, with the study of meteor showers and their possible influence on rainfall. The present author has actually shown this to be as relevant today as it was then, see Barnes [13] drchrisbarnes.co.uk/Putting the Meteors back in Meteorology %281%29 %281%29 %281%29.html
The upshot of that paper is that at least in the uk
for the past few decades, warming is
adequately described by a single
equation involving incoming meteor and solar
flux ( linked to galactic cosmic
ray flux ) and a constant factor.
With regard to high energy particles
of solar and cosmic origin, during periods of intense space weather,
substantial amounts of protons and electrons are injected into different
latitudes of the polar regions, leading to solar proton events (SPEs) and
energetic electron precipitations (EEPs).
These, via the earth to space electric circuit have enormous consequences for clouds on earth and hence
weather/climate. The present author
has shown that Earth A.C. Power Grid systems can dramatically alter EEP
events. Hence Causing climate
warming. This too is a completely
missing parameter in existing climate models.
Moreover, the energy in the world’s
power grids is more or less
constant right now and this would tie in
with the constant factor identified above.
Another
important factor not included in many climate models is energy transport due to infrasound and
acoustic gravity waves ( AGW)
which previously were regarded to have natural origins such as
microbaroms, mountain ranges and the like but these days pick up contributions
from windfarms and ionospheric heaters
etc. A more extensive treatment has been provided
by the present author at drchrisbarnes.co.uk/Weather
and Climate Control a Reality.htm, [14]
Volcanism
Volcanism is far from trivial to represent in any model. All volcanoes and their eruptions are unique . The solids, liquids, aerosols and gases injected are equally unique as are the volumes, ferocity, duration and heights of the eruption and injections. The present best we can do is to look at past famous eruptions and the logged weather and climatic effects that have followed.
Roebuck and Mao (1992) [15] examined the Northern Hemisphere winter surface temperature patterns after the 12 largest volcanic eruptions from 1883–1992 shows warming over Eurasia and North America and cooling over the Middle East which are significant at the 95% level. This pattern was found in the first winter after tropical eruptions, in the first or second winter after midlatitude eruptions, and in the second winter after high latitude eruptions. The effects were independent of the hemisphere of the volcanoes. An enhanced zonal wind driven by heating of the tropical stratosphere by the volcanic aerosols is responsible for the regions of warming, while the cooling is caused by blocking of incoming sunlight.
In 2022 we experienced one of the largest eruptions of modern times. The underwater volcano Hunga Tonga was possibly unique in the gargantuan volumes of seawater and steam injected into the stratosphere thought to have swelled the stratospheric volume by over 10%.
2023 and 2024
have seen two of the warmest years globally
exceeding predictions of all climate models including contributions due
to the recent strong El Nino. If
Roebuck and Roa is generally applicable we may now start to see very significant
cooling,
Feedbacks
Climate
models also refer to feedback mechanisms. Interesting,
they expect storms and lightening intensity to cause positive feedback and have
incorporated accordingly. However, the
present authpr has advanced valid arguments to suggest that they could be very
mistaken, see Barnes [16] . http://www.drchrisbarnes.co.uk/lightningf2.htm
The
present author also showed that increased shipping has been an enormous
negative feedback mechanism for the climate system sadly destroyed by the ‘green’
drive for low sulphur fuels.
The
present author has on multiple occasions in the public domain, e.g. Twitter and
Facebook, published explanations of how dangerous ir
was to remove coal and wood smoke from our environment. Both of which nucleate large, fluffy, low
and mid -level cumulous cooling cloud, estimated to have many times to climate
cooling potential that its component carbon components may have according to
traditional ideas. See for example Robock
1991 [17] https://direct.mit.edu/books/edited-volume/4901/chapter-abstract/623596/Surface-Cooling-Due-to-Smoke-from-Biomass-Burning?redirectedFrom=PDF and that the cooling effect from coal or oil
smoke could potentially be up to 8 times
its heating effect https://www.jstor.org/stable/26196392.[18].
It is
generally agreed that increased atmospheric CO2 will cause increased
plant growth and global greening and this is detectable by satellite and used
in some earth system models. However it has
recently been shown that the ensuing carbon sequestration may be being
underestimated by an average of 44% and
by as much as 60%, see Rotter, Nature, June 2019. [19]’
The
present author is a keen gardener and
has observed a dramatic increase in garden plant, lawn and weed growth of late,
in particular that of fleshy large leaved
plants. It has been reported just this
month, December 2024, that Brussels
sprouts are now on average 35% larger than ever before. Here, then, we have another substantially missing
negative feedback parameter.
Another
negative feedback factor not readily taken into account is that of terpene aerosol cooling as a
result of increased vegetation, see for example, Spracklen and Bonn (2008) [20].
It
can be seen from the above that in addition
to issues with assumptions and
starting data, there are so many
missing or aberrant couplings and feedbacks as to
render present climate models of little if any value. In other words, they fail and will continue
to fail .
So the models are wrong, but the planet is
warming this cannot be denied. The real reasons for warming.
To
the author it is glaringly obvious that the largest single energy source for
our planet is our sun. Not only does at
supply enormous radiant heat, some 1400 watts/m^2 at the top of our atmosphere, but also endless streams of energetic
particles and varying magnetic fields which
in turn influence space weather hence our weather and climate. Its magnetic fields are inseparably entwined
with earth’s and this too will influence positions of
earth’s magnetic poles and hence ocean currents. The
sun’s motion and that of the other planets will influence earth’s motion and
relative position in spce and hence weather and
climate. It is both common sense and self -evident for
the sun to be the major driver of climate
yet those who should know better have simply lost sight of the fact. They will state that because solar TSI only varies by about 1 W/m^2 or up to
-3W/m^2 in the Maunder minimum that it could only possibly account for
about 10% of current global change, see for example Kopp (2016) [21] .
What
is not included is the climate relationship to solar magnetic indices.
The earth’s mantic field modulated by the sun deflects energetic
particles.
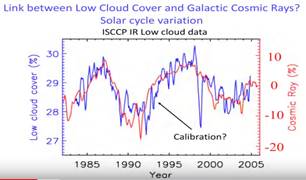
Danish
Professor Henrik Svensmark is a leading physicist of cosmic radiation.
At
the end of 2018 he made a presentation at the 12th International Climate
Conference in Munich, [22] where he demonstrated that the climate is
indeed modulated in large part by cloud cover, which in turn is modulated by
solar activity in combination with cosmic rays. Further a presentation was also
made to the UK House of Lords!
His
theory is that cosmic rays, which are extremely fast-flying particles – which
originate from dying supernovae – travel through the cosmos, strike the Earth’s
atmosphere and have a major impact on cloud cover and thus climate on the
Earth’s surface.
This,
Svensmark says, has been confirmed in numerous laboratory experiments.
They showed
how solar activity modulates the cosmic rays striking the atmosphere, and thus
the climate-impacting cloud cover.
Dr.
Svensmark shows that there are powerful correlations worldwide between solar
activity and climatic cycles, and so the sun is clearly playing a role in
combination with the cosmic cloud-seeding rays. Hundreds of studies confirm
this.
Observations
and proxy data show that “when you have high cosmic rays, you have a cold
climate” because of greater cloud cover.
Sun
modulates the cosmic ray intensity hitting the Earth’s atmosphere
According
to Svensmark, the net effect of clouds is to cool the Earth by up to 30 W/m2. This figure is more than 10 times that being
advanced by climate models for the influence of CO2.
Cosmic rays seeding low-level
clouds, will act to cool the climate.
In periods of intense solar
activity, the sun’s magnetic field engulfs and shields the Earth’s
atmosphere from the cloud-seeding cosmic rays, thus less low-level clouds
are formed and the Earth warms.
Vice versa, i.e. during
periods of low solar activity, the sun’s magnetic field is weaker, and so more
cosmic rays are able to penetrate into the atmosphere
and seed clouds. The resulting clouds act to cool the planet.
Confirmed by experiments
Svensmark’s experiments confirm
that solar cycles impact energy changes in the oceans by an order of 1.5 W/m2 over
an 11-year cycle and that his findings are consistent with climate changes over
the Holocene and even geological times going back more than 100 million years.
Over geological history,
especially when the Earth traveled through one of the
spiral arms of the Milky Way, cosmic rays striking the atmosphere were very
intense and thus led to extremely cold conditions known as the Snowball Earth episodes.
Other scientists insist the
episodes were caused by intense volcanic eruptions.
Significant solar changes in
Earth’s energy budget
Dr. Svensmark summarizes the
solar activity/cosmic ray climate modulation system with the following chart:

As
mentioned above, a new an
potential cause of anthropogenic warming, discovered by the present author, is the influence of the world’s power grids on
natural EEP. i.e. the Ionization process in Svensmark’s diagram.
Interestingly
most warming is reported in the Northern Hemisphere where most of the world’s
power grids are located. With this
together with the present solar maximum we would perhaps expect less low cloud and more
warming. This is exactly what is being
observed. And indeed what has been
reported in the mainstream literature very recently indeed [23].
Ocean
heat store and ocean current flows are also crucial in any understanding and
modeling of climate. The earth
magnetic field via solar influence has a 3D toroidal modulation effect of ocean
currents and vice versa. The full
effect would doubtless be impossible to fully model as the poles are also shifting.
However, nevertheless, it ought
to be borne in mind as yet another missing and
potential influence on our complex climate system. For example Rampant Groundwater Pumping Has Changed the Tilt
of Earth’s Axis by some 32 inches over
the last two decades. The net water
lost from underground reservoirs between 1993 and 2010 is estimated to be more
than 2 trillion tons. That has caused the geographic North Pole to shift at a
speed of 4.36 centimeters per year, researchers have calculated. The results
appeared on 15 June in Geophysical Research Letters[ 24.]
Of
course Earth’s axial tilt of approximately 23.5 degrees significantly impacts
how sunlight is distributed across various latitudes. This tilt leads to
variations in solar energy received, resulting in different climate zones. In the author’s estimation the above change
due to water pumping is that it will be insufficient to impact climate.
Even
in a simpler sense there are ocean heat cycles, especially AMO which are being
overlooked in our estimation of climate.
The present author has made a brief
investigation of solar Ap and SST
since 1850 and finds a near perfect
correlation for SST allowing a 47 year lag after the
corresponding Ap input.
Finally,
no discussion of climate change would be complete without consideration of the
South American rain forests. Effects
on global temperature are not quantifiable with the computational;
power available to the author. However
undoubtedly significant effects on atmospheric rivers and global circulation
will have occurred.
As we
can see there are multiple hitherto not considered or rarely considered natural
causes of global change brought here to the fore. Models are incomplete or inadequate without
them.
Are
there any other anthropogenic causes of warming?
A
second potential cause of anthropogenic warming not properly considered is
waste heat. Even if heat cannot be permanently trapped by GHG’s, it must flow along a
gradient to space and it is generally acknowledged that said gradient will be
the adiabatic lapse rate. Lapse
rates are fixed or relatively fixed. And as we have seen above and in reference
[4-6]. Moreover, Barnes (2019)
too [25] has also confirmed that
a simple solar system model not CO2 can adequately account for planetary
temperature based on isolation and gravitation in line with reference [4]. Thus,
taking our fixed lapse rate, it stands
to reason if we feed more heat in at the earth end more heat will exit at the sky end, but the temperature difference between the source and the sink will remain constant so the source temperature increases as a
function not of CO2 but as a function of waste heat.
The
author has discussed UHI and its waste heat component recently in more detail
in reference [6]. The upshot is
that potentially in city and urban
areas, waste heat is the major cause of
observed warming, yet averaged over the whole globe reduces to tens of
milliwatts per meter squared.
Do we
need Net Zero?
The
short answer is no. The conclusion of
my work is that no amount of CO2
reduction will significantly impact global change. The sun and clouds are the primary control
knobs for this planet not CO2.
However,
if we want our cities to be cooler we must limit or re-cycle the amount of
waste heat we produce.
Moreover,
the means by which we presently transmit electrical
energy may be causing unintentional
warming by reducing the amount of low cloud.
Ironically since the 1980’s clean air acts and the like have further
removed low cloud by removing coal and wood smoke nucleation. Further ironically and much more recently, a
decision was made to use low sulfur ship fuel.
This has further reduced low level marine stratus cloud and increased
incoming solar radiation.
Either
we use local electricity generation only and all go off grid or we use HVDC
transmission or undergrounded AC transmission.
And/or we immediately re-instate the use of fossil fuels for domestic
fires and electricity generation.
There
will be those who will not like this work.
There will even be those who attempt to ridicule or disprove it. But the evidence is clear. Thus, it is hoped their
will be some, however few, who will have
the intellect and the courage to take
its conclusions forward.
References
1. Clive Best, see https://clivebest.com/blog/?p=4475
2. https://isccp.giss.nasa.gov/role.html
3. https://link.springer.com/article/10.1134/S0018151X19040199.
4. https://www.researchgate.net/publication/317570648_New_Insights_on_the_Physical_Nature_of_the_Atmospheric_Greenhouse_Effect_Deduced_from_an_Empirical_Planetary_Temperature_Model Nikolov and Zeller (2017).
5. Ned Nikolov & Karl Zeller: Exact
Calculations of Climate Sensitivities Reveal the True Cause of Recent Warming –
Iowa Climate Science Education May 2022.
6. Are
urban heat islands correctly defined and what is the big deal for climate
warming. By Dr Chris Barnes, Manager at Bangor Scientific and Educational
Consultants http://bsec_wales.co.uk February 2025
8. drchrisbarnes.co.uk/WFCON1.HTM
(2014).
9. http://www.drchrisbarnes.co.uk/AVICON.htm
10. Sensitivity of cirrus and contrail radiative effect on cloud
microphysical and environmental parameters - CentAUR Wolf and Boucher (2023)
11. https://acp.copernicus.org/articles/15/11179/2015/
12. https://acp.copernicus.org/articles/10/2053/2010/.
14. drchrisbarnes.co.uk/Weather and Climate Control a
Reality.htm,
15. Roebuck
and Mao (1992) Winter warming from large volcanic eruptions - Robock - 1992
- Geophysical Research Letters - Wiley Online Library
16. http://www.drchrisbarnes.co.uk/lightningf2.htm
17. https://direct.mit.edu/books/edited-volume/4901/chapter-abstract/623596/Surface-Cooling-Due-to-Smoke-from-Biomass-Burning?redirectedFrom=PDF Alan Robock Book Chapter 1991.
18. https://www.jstor.org/stable/26196392
19. Rotter,
Nature, June 2019. [20]’
20. Boreal
Forests, Aerosols and the Impacts on Clouds and Climate on JSTOR
21. G
Kopp, Magnitudes and timescales of total
solar irradiance variability, J. Space Weather Space Clim., 6, A30 (2016), Magnitudes and timescales of total solar irradiance
variability | Journal of Space Weather and Space Climate
24. Rampant Groundwater Pumping Has Changed the Tilt of Earth's
Axis | Scientific American
25. drchrisbarnes.co.uk/Solarsys.htm
.