A Collection of 5 full length Scientific Works and Comments on
the HUM including ‘humans as
radio acoustic atmospheric sounders’/‘electromagnetically enhanced infrasound
detectors’ by Dr Chris Barnes, Bangor Scientific
and Educational Consultants, Bangor, Gwynedd, Wales, UK, email manager@bsec-wales.co.uk
STOP PRESS FOR THE VERY LATEST PAPERS
PLEASE SEE http://www.drchrisbarnes.co.uk/HUMPUBS.htm
OR FOR ALL MY PUBLICATIONS AND PATENTS
SEE: http://drchrisbarnes.co.uk/publications.htm
Once into publications page scroll down to
section on Internet -self publications, the last few give the very latest ideas
with some elegant results
1. Letter to the Editor Journal of Scientific Exploration
The article ‘The Hum: An anomalous sound heard around the world’ Journal of Scientific Exploration, Volume 18, No4, pp571-595-2004 gives an excellent history and background to the Hum yet sadly, seems to be fundamentally flawed in its main conclusion.
It seems illogical to suppose that very low frequency radio transmissions from TCAMO aircraft can be the sole cause of the Hum, particularly in the light of the author quoting on the article’s last page, page 590, stating that there are no reports of the Hum near to even higher powered ground based vlf broadcast installations. There are two possible ways of constructively reconciling this. One would be if the HUM required an additional radio or acoustic frequency co-factor or component found at all specific HUM sites but not close to the US navy’s VLF stations. I have some experimental and anecdotal evidence that the HUM requires multiple factors for its perception, which eventually I hope to publish. A second and at this stage equally valid proposal would be that the Hum is detected by humans as a result of some kind of quantum biological process therefore the strongest E and H fields at low or whatever other frequency, see p583, might not necessarily coincide with the strongest perception of the Hum, if that is the Hum is entirely electromagnetic in origin.
I would also like to clarify the papers’ comments on
the aurora. There are several references which pre-date the paper which explain
sound generation by the aurora and one which purports to have audio –recorded
the extremely weak sound of the aurora. Thus the aurora being a four fold emitter of sound, broad spectrum radio waves,
magnetic pulsations and often light as well is nature’s electrophonic concert
for the taking. Presumably the body reacts to the aurora by enhanced perception
involving dueling senses. If we can begin to understand human sensitivity to
the aurora we may understand the Hum as well.
Elf and vlf radio
transmissions are capable of traveling for thousands of kilometers on this
pretext of causality alone; it seems strange how one could escape
the Hum by traveling only a few tens of miles, see page 575. In a similar vain, it is interesting to note how there seem to be these
anecdotal reports refereed to in the paper of
an acclimation period of uptown 48 hours when ‘hummers’ move home. The
paper refers to HUM hearers having frequency matched tones in the range 40-80
Hz. A moving car generates very high levels of infrasound and low frequency
noise in the range 15-200 Hz i.e encompassing the Hum
range. Being a ‘hummer’ myself I have personally encountered this effect.
I often have to drive to meeting about 100 miles distant and return home the
same day. My wife is also a ‘hummer’ and even on occasion when the Hum is
booming in according to her I cannot hear it for at least the first night I
return. I believe therefore traveling noise (particularly in car) induces
a sort of low frequency threshold shift (TTS) in the ear of
hummers.
I have lots of other material to report but want to
keep this brief. I will endeavor to publish more extensively in the future. I
trust your readership will find my comments useful.
Yours sincerely,
Dr
Chris Barnes Ph.D
Bangor Scientific Consultants Wales UK LL57 2TW
2. Search for the Cause of the HUM, the case for infrasound.
By CHRIS BARNES
Bangor Scientific Consultants, Llwyn Heulog, Bangor, LL57 2TW.
Abstract
The
history, cases and characteristics of the HUM are discussed in terms of three
pre –existing theories of the HUM; electromagnetic, infrasonic and
gravitational. On the strength of the available evidence a new hypothesis is
advanced, that the HUM is both external and internal to the subject and that
for perception of the HUM at least two components are required with one
component being infrasonic. This hypothesis is tested and validated for three
related subjects who have considerable right-ear monaural sensitivity to
infrasound. Further experiments suggest that exposure to certain radio
frequencies above 30 MHz might increase human sensitivity to infrasound and
hence the HUM. Proliferation infrastructure capable of radiating
infrasound and electromagnetic technology together then might account for the
ever increasing numbers of people reporting the HUM.
Introduction
The HUM is an anomalous sound, mainly but not exclusively described by sufferers as that of an distant idling diesel engine. It is heard by estimates of between 2-11% of the population throughout the World most essentially in Westernised nations. Being a highly subjective phenomenon there is little wonder that there are few published scientific works on the HUM to be found.
It is particularly difficult to do Science with such anomalous phenomena because one is mainly dependent on anecdotal reports. However, if these contain enough congruent detail certainly some significance ought to be afforded. With the advent of the better communications, in particular the internet it is possible to search for such similarities in HUM reports on different forums, websites and bulletin boards.
Reported Cases and Causes of the HUM
Sparse reports of the HUM began in Britain in the 1960’s and have been more extensive since the early 1980’s and similarly so in the USA and mainland Europe since the 1990’s. The most famous cases of the HUM reported in the UK media are perhaps those known as the Bristol Hum and the Largs Hum and more recently the Swanage Hum. The HUM is also heard extensively at the author’s residence in Bangor, Wales.
The most famous cases in the USA are perhaps those cases known as the Taos Hum and the Kokomo Hum. The most recent HUM reports appear to be coming out of New Zealand. From its history it might be pertinent to assume the HUM is somehow connected with modern technology and infrastructure. In the UK in the 1980’s UHF television technology was first expanding and large expansions in infrastructure included motorways and their bridges, known sources of infrasound (refs) together with significant expanses in the power grid and generation capacity particularly hydroelectric pumped storage,a known source of seismic infrasound (refs). There was also the inception of the high pressure gas grid both also significant sources of acoustic sound ( refs) and infrasound ( refs), particularly hydroelectric power and pumped storage schemes( ref). Most recent sources of sound and infrasound in developed nations are wind turbines and undersea coastal oil and gas exploration (refs).
Some have suggested the HUM has exotic electromagnetic causes, such as very low frequency transmissions from military aircraft known as TACAMO an abbreviation standing for ‘take charge and move out’. (Deming 2004). The fact that the HUM is experienced inside a Faraday screen and a stationary vehicle tends to rule out at least the electric field component of electromagnetic sources as an option, but it should not be forgotten that magnetic fields will permeate these situations unadulterated. The fact that the HUM can still be heard inside anechoic chambers tends to rule out that the HUM is an acoustic signal but it is notoriously difficult to prevent airborne very low audio frequencies and infrasound entering such a chamber or earth bound vibrations. Alternatively, the behaviour in anechoic chambers in particular is suggestive that the HUM is either internal or has a cause which is neither electromagnetic nor acoustic. Dawes (2006) has suggested that the HUM may be due to the influence of the power grid on the earth’s gravitational field. Further it has been suggested that the HUM may not have an external cause at all and that it may be all in the mind, a function of the stress of modern living or of a physiological state known as tensor tympani syndrome (ref). Barnes (2007) has suggested, in reply to Deming (2004), that an electromagnetic HUM may require an acoustic co-factor and that the infrasound and low frequency noise generated by car interiors might explain why ‘Hummers’ or people afflicted by the HUM gain up to forty-eight hours relief after a significant vehicular journey. The hypothesis developed here is that the HUM is both internal and external in that it depends on more than one external signal and processing of those signals by human audition. This is not inconsistent with Barnes (2007) previous findings or suggestions. It will be shown that two or more external signals of appropriate frequency with at least one in the infrasonic range can produce a ‘HUM like’ experience under laboratory conditions in certain experimental subjects and that certain radio frequencies appear to enhance low frequency acoustic perception in those subjects.
Characteristics of the HUM
Possible causes of the HUM might be ascribable after considering common threads in its anecdotally described characteristics, such as; frequency or rather frequency of tones matched by sufferers, pulse repetition rate, times the phenomena is experienced, locations where the phenomenon is and is not experienced, effects of the weather and environment on the intensity of the HUM, effects of other senses on the HUM and finally remedies which sufferers use for escaping or attenuating the HUM.
HUM frequency and amplitude
HUM sufferers often tone-match its frequency in the range 30-80 Hz where it is described as a quasi –periodic pulsation withy pulse repetition frequencies varying between 0.5 and 5 Hz. To this end many suffers describe the HUM as sounding like either a fly or wasp trapped in a bottle or even a distant throbbing diesel engine or rumbling machinery. Sufferers also describe the amplitude of the HUM as varying from the barely discernable yet frustratingly annoying to the downright unbearable wherein they feel their heads and even whole bodies are vibrating and their ear drums are popping. To this initial end when the phenomenon is quiet possibly accounts for it mainly being experienced at night. Despite the assertions of sufferers and a paper suggesting the cause of the HUM is due to specific aircraft borne electromagnetic transmissions (Deming 2004) no per-existing study has yet found any signal either acoustic or electromagnetic in the requisite frequency range which has modulation which behaves as reported. This has led some to conclude that the HUM may be all in people’s minds or at least due to some kind of physiological ailment such as Tensor Tympani Syndrome (ref). However one should perhaps err with a note of caution because low frequency acoustic measuring equipment is notoriously insensitive and inaccurate ( ref) and it is known that there is a certain sub-set of the population with extremely sensitive low frequency hearing, some of whom can even hear infrasound ( ref).
HUM time of day
Many HUM sufferers report the phenomenon only at night. There are four possible reasons for this. Firstly in most locations with the exception of City areas it is inherently quieter at night and there are less masking noises. Secondly with low or medium frequency radio waves or infrasound as a potential cause of the HUM, these would both propagate better at night. Thirdly, pumped storage hydroelectric power schemes tend to pump water more at night. Finally, there is less vehicular movement. It is possible that vehicular movement would randomise the arrival of any coherent signals if such a phenomenon were required in HUM perception.
HUM locations
The HUM as reported elsewhere (refs) and anecdotally by sufferers on numerous internet forums and chat rooms is often, although not exclusively, experienced in coastal locations or near mountainous regions, both places where natural infrasound generation is possible. The HUM is rarely experienced outdoors but is mainly experienced in houses or stationary vehicles. Somehow houses and vehicles must amplify the HUM. One possibility is that they simply block out masking noises such as wind. Another is that they facilitate transmission of ground borne vibrations to the body. Houses with chimneys might particularly be expected to amplify the HUM if it had an infrasonic component due to the Helmholtz effect (ref) . Similarly cars have structural components which resonate at infrasonic frequencies (ref). The HUM is experienced inside Faraday screens or cages and also inside anechoic chambers.
Weather and environment
There are all kinds of reports of the HUM varying with the weather but they are mainly inconsistent. The most credible seems to be the report of the HUM ceasing after very heavy snow fall which halted vehicular movement. The implication is that either the HUM is itself some way due to vehicular movement or that the snow on the ground is effecting the propagation of whatever is carrying the HUM. In respect of the former roads with continuous traffic flows such as motorways are known sources of infrasound. The present author has evidence that the HUM depends on wind speed and direction and also on high level winds or jet streams and hopes to present this elsewhere.
Other senses
There are reports of people stating that the HUM intensity increases when they look at artificial light or moonlight. Sound and infrasound are more likely to propagate better under a moonlit sky as the atmospheric boundary layer is likely to be more stable. Alternatively it is possible that atmospheric scintillation is occurring at a rate linked with one or more components of the HUM. The body may be able to detect this through synasthesia or duelling of the senses. Humans are known to make use of this in the cognition of learning (ref).
Relief from the HUIM
The HUM is reported to come and go at various locations almost spontaneously and at others to present almost incessantly. Some state that they can only get relief from the HUM by travelling by car for several hundred kilometres but yet even then when staying at an alternative location the HUM catches up with them after a couple of days. The present author has noticed this effect to be very pronounced even when travelling away from and back home in the same day. In the hypothesis advanced here that at least one component of the HUM is due to infrasound, car travel ought to cause a temporary shift in the threshold of the ear’s sensitivity to such sound. It is not known in which way car travel might affect the HUM if it were due gravitational field effects. Some, but not all, claim some relief from the HUM by using earplugs, suggesting the perhaps at least some component, if not all of the HUM may be acoustic, if not in the usually sense of the word. A wholly infrasonic HUM would be almost impossible to attenuate using earplugs because they are less effective at low frequencies and body resonances and bone conduction to the hearing apparatus would come into play
Some claim that they get relief from the HUM by descending into deep underground limestone caves. The HUM is not reported inside moving vehicles as far as the author is aware, presumably because the broadband infrasonic and acoustic sound levels grossly outweigh the HUM.
Deep underground all forms of surface wave energy; acoustic, infrasonic surface vibration and electromagnetic (except extremely low frequency) will be heavily damped and attenuated. It is impossible to say then with any certainty which cause of the HUM the ‘limestone cave’ effect supports. It is possible however to deduce from this that it is unlikely the HUM is not due to any bulk or very deep vibration mode of the earth. Surface induced seismic vibrations from specially designed vibrators can in some circumstances be detected as much as 350 Km distant from the source and 50 Km deep (ref).
Experimental case for infrasound
A series of experiments have been performed so as to test the hypothesis that at least one component of the HUM is infrasonic. People who perceive the HUM are known collectively as HUMMERS. The author’s wife has been a HUMMER since October 2003, the author and his son started hearing the HUM about 15 months later. The author’s sister-in law is also a HUMMER. The first three subjects perceive the HUM intermittently in their North Wales residence. The fourth subject also perceives the HUM in a nearby residence but was not used in the detailed investigations herein.
Experiment 1 Infrasonic Hearing
An experiment was conducted to ascertain if the subjects could hear infrasound. Freeware Audio synthesis software courtesy V.Burel was employed on a Fujutsi –Seimens Amilo Notebook Computer driving HD-3030 stereo headphones. All three subjects could clearly perceive low frequency down 20 Hz and lower to infrasound down to 5Hz monaurally in their right ears. The author and his son have normal hearing in their left ears and could perceive sounds from 16 KHz down to 27 Hz in their left ears. The author’s wife has age related high frequency hearing loss and could barely perceive 10KHz in either ear but could perceive infrasound monaurally in both ears with the left ear being some 10dB less sensitive than the right. The author’s wife and son lost tonal sensation at about 30 Hz simply describing the infrasound as a ‘buzzing’. On occasions the author felt that tonal discrimination continued whilst lowering the frequency from say 40 to 15 Hz but could discern discrete clicks below the lower frequency. On other occasions lowering the actual frequency in the range around 25 Hz seemed to produce an actual increase in perceived frequency, in line with previous reported findings that tonal discrimination of infrasound is not possible (refs).
Experiment 2 Measuring infrasound at HUM sites
After reading the work of Deming (2004) the author decided initially to test an electromagnetic hypothesis of the Hum. The subjects visited various mobile phone cell towers, a 400 MHz TETRA mast, UHF TV station which also carries VHF FM and DAB and finally a medium wave transmitter station. When they heard the HUM in their parked car near the TETRA mast and TV station and underneath 400 kV power lines, this at first seemed to corroborate the electromagnetic hypothesis. However, their experience was not consistent and seemed to depend on the weather conditions. At these locations however, unlike their home, when present, the HUM was present and could sometimes be perceived by day as well as by night.
Realising that infrasound can be generated by Aeolian modes of power lines (Irvine 2006), it was decided to try and detect infrasound under the power lines and when both subjects were reporting the Hum. A ‘big ear’ dynamic microphone was constructed based on a guitar amplifier loudspeaker feeding through a 1: 25 step up matching transformer giving a sensitivity better than (-60 dbSPL from 8 to 80 Hz) into the sound card of the Fujitsu –Siemens computer running Spectrum Lab software set up as a 0-50 Hz spectrum analyser with colour palette adjusted to indicate an appreciable acoustic dynamic range of approaching 120 dB.
A number of other locations were chosen for infrasound analysis on the basis of them being either close to a known or expected source of infrasound such as at Dinorwig pumped storage Hydroelectric plant which has six 500 rpm synchronous pump turbines and is expected to produce seismic infrasound (Grainger and McCann 1977) at 8.33 Hz (Pritchard 1and 2 (1988)).Other locations where both subjects could either perceive the Hum very readily or not at all were also tested. In all cases both subjects listed acutely for the Hum prior to booting the laptop and opening the spectrum analysis program so there would be no tendency for suggestion from the observed traces. Infrasound spectra were also recorded at the home address of the subjects both when the Hum was present and absent. The effect of passing motor vehicles was also recorded.
Results
The spectrograms of the results between 0-53 Hz were logged in the laptop memory and the corresponding JPEG files used to produce the figures below. The x-axes represent frequency 0-53 Hz and the y-axes time, 3 minutes per minor white division.
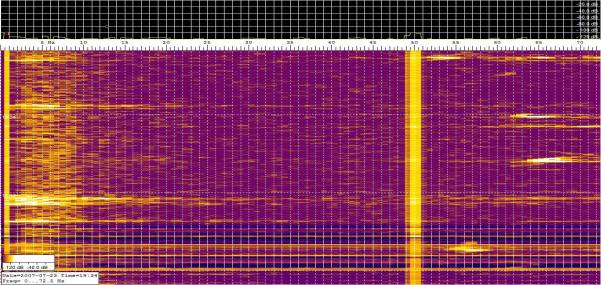
Figure 1
Both subjects could hear the Hum overwhelmingly loud at Dinorwig, grid reference …. The infrasound spectrum recorded at this location is shown in Figure 1. A distinct band of infrasound between 2-11 Hz can clearly be seen, with monochromatic bursts at approximately 3.5, 6.5 and 8.5 Hz. The signal at 50 Hz is thought not to be acoustic, rather an artefact due to magnetic field induction directly into the speaker voice coil from a nearby transformer.
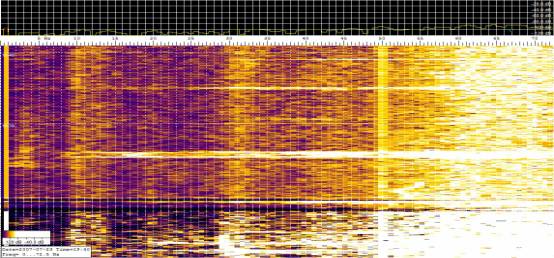
Figure 2
A wider frequency spectrum obtained at another location, grid reference …. across the lower lake at Dinorwig shows some narrower band infrasound at approximately 3.5, 10 and 32 Hz and a large amount of acoustic noise in the region of 60-70 Hz, see Figure 2.
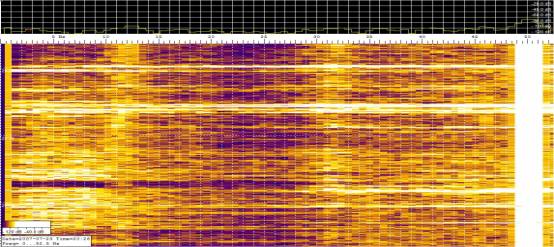
Figure 3
Figure 3 shows the very noisy infrasound spectrum recorded underneath super grid 400 kV power conductors at grid reference ………………….. and within that spectrum shows three bands of almost monochromatic infrasound at approximately 11, 13.5 and 32 Hz. The huge signal at 50 Hz is most likely due to electromagnetic induction as no audible 50 Hz was perceived by either subject yet both perceived the Hum at this point.
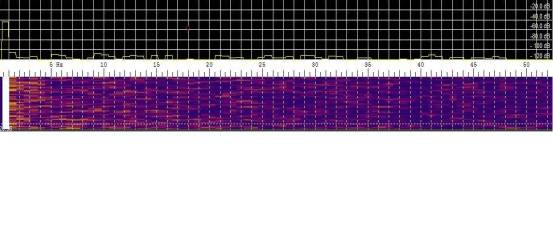
Figure 4
Figure 4 is the infrasonic spectrum recorded at a site in the countryside where the HUM was absent as reported by all the subjects, grid reference …… The part of the spectrum between 4 and 53 Hz shows an almost complete absence of infrasound and acoustic noise. There are some very weak spontaneous infrasound bursts at 1.5 and 3.5 Hz but obviously in view of the subjects reports these were neither strong enough, continuous enough or on a suitable frequency to initiate Hum perception in either of the subjects.
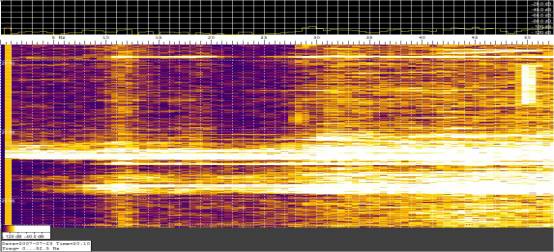
Figure 5
The result shown in Figure 5 above is for that of a site at grid reference ……………..where both subjects perceived the Hum in their parked vehicle but where no obvious source of the Hum was known. As can be seen there is a strong monochromatic signal at approximately 11 Hz. There is also evidence of monochromatic acoustic signals in the region of 19, 29 and 32 Hz and broad-band acoustic noise to above 50 Hz. The very broad -band signal bursts lasting some 6-9 seconds and some 60 decibels greater in amplitude are due to passing vehicles.
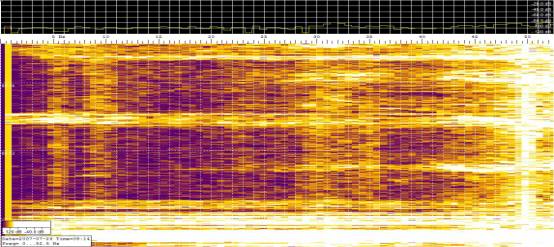
Figure 6
Figure 6 shows the spectrum in the main bedroom at the author’s residence on the morning of 26th July 2007. Both subjects were experiencing the Hum and as can be seen there are two moderately strong bands of monochromatic infrasound at approximately 5.5 Hz and 9 Hz and a very weak band at 3.5 Hz. There are two less coherent acoustic signals at 31 and 34 Hz and mains interference at 50 Hz. The broad band bursts are interruptions by passing vehicles.
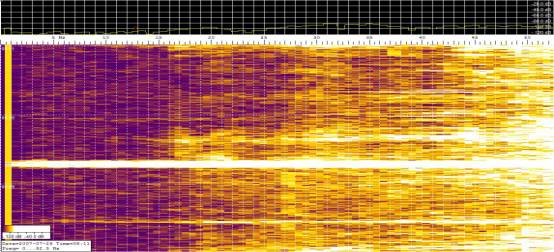
Figure 7
Figure 7 shows the spectrum a few minutes earlier when the Hum is not present at the authors’ address.
There is broad band acoustic noise 22 Hz upwards and some bursts of 50Hz interference but only random weak incoherent bursts in the range 2-16 Hz. There were some fifteen passing vehicles during the three minute recording. Cancellation of the lowest frequency infrasound signals may have resulted in loss of the HUM. Such signals can be disrupted by vehicles on a local basis (Daigle 1984) and this probably accounts for lack of Hum reports in large cities, see later.
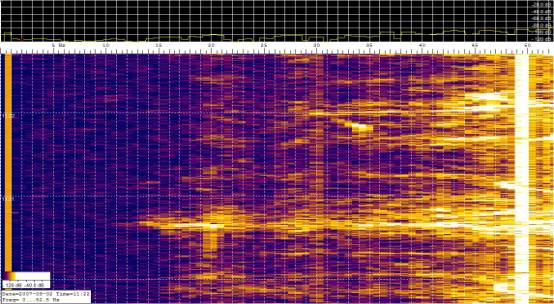
Figure 8
The trace in figure 8 was obtained late morning when the Hum was not audible at the author’s house and a few days after the data of figure 7. Although there are some random acoustic bursts around 20 Hz and some more narrowband signals at 30 Hz, the infrasonic part of the spectrum below 20 Hz is incredibly quiet. It seems therefore for HUM perception in the subjects of this study at least some infrasound well below 20 Hz is required.
It should perhaps be noted that electromagnetic signals such as those of TCAMO and others as a potential source of some cases of the HUM is not entirely ruled out by this present hypothesis and study. The mechanism of the electrophonic interaction perceived here would be simply because such signals can generate sounds by means of passive inter-modulation or passive demodulation either directly at their antenna or due to non-linear effects at corroded metallic surfaces or vibration due to magnetic induction. Depending on the precise frequency and modulation frequency or data rate of such signals, generation of secondary infrasound is a possibility. Following this hypothesis, the data from figure 10 are fascinating. These data were gathered about 100 metres from a TETRA (Trunked Emergency Terrestrial Radio) radio mast transmitting at some 26 dBW in a country area where there was little wind or vehicular movement and where the HUM could be heard by all the subjects. Besides some broad band infrasound between 3 and 8 Hz and a narrower signal in the region of 12 Hz, there is also a clear but quite weak narrowband signal at 17.6 Hz, one of TETRA’S pulse repetition frequencies. It is presently not known if a signal at this frequency alone would be sufficient to cause the Hum.
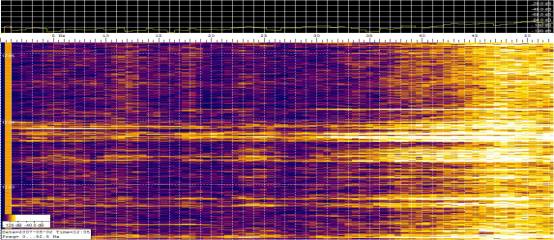
Figure 9
Other subjective effects observed in this study
All three subjects find that subjective Hum level reduces with increasing wind speed, however when more detailed evaluations are made, there appear to be imposed sinusoidal variations in this behaviour. Wind is known to destroy the coherence of seismic infrasound (Withers et al 1996) or in the case of the HUM might simply be providing a more familiar and tolerable broad band masking noise. Withers et al (1996) have shown that winds with speeds as low 3m/s can, in certain circumstances, destroy the coherence of seismic infrasound at 15 Hz and below whereas winds of greater than 8m/s were required to reduce the coherence of sound in the 23-55Hz frequency band. Assuming linearity between wind speed and coherent frequency destroyed and applying this method to data recorded at the authors’ home for the north –west wind direction which most easily quells the Hum, extrapolation from the graph suggests the arrival of coherent infrasound at frequencies of approximately 3.4, 8.8 and 29 Hz, in remarkable agreement with those measured by the ‘big-ear’.
All three subjects perceive the following effect when using earplugs to try and defend against the HUM. Without ear plugs, the HUM has its usual pulsating engine or wasp in bottle tone. The pulse repletion frequency is estimated to vary quasi-periodically from roughly 1-3 Hz. On nights when the HUM is particularly intense, Inserting ear plugs removes the tonal component and leaves a sound which can only be described as a fast hammering in the region of 10 Hz or so. Earplugs would be expected to remove higher frequency components and not low frequency components. The inference is that possibly two or more of the frequency components as recorded by the big ear or as detected by the wind-speed experiments must somehow beat together in the ears or heads of the subjects to produce the effect which is the HUM. This is in strong support of the hypothesis that the HUM is both external and internal and that a signal which is the HUM can therefore never be simply measured in the environment, unless that is additional signal processing is applied.
Experiment 3 Hum simulation
Following the above subjective effects and initial hypothesis that the HUM needs more than one external component for perception and that internal perception is a function of human audition and that at all the above HUM sites infrasound appears to be present at two or more frequencies below 20 Hz in addition often to low frequency sound in the region of 30 Hz it was decided to see if conditions could be set up experimentally which would synthesise the HUM. The V.Burel software was set up on two other computers and all three computer sound cards were fed into separate loudspeaker systems. The subjects sat about 1 metre away from the loudspeaker systems and listened binaurally. It was found that HUM like effects could be perceived for any infrasound in the region of 9-17 Hz when outputted at similar amplitude to any audio tone in the region 29-75 Hz. A third tone was not always necessary but equal amplitude tones of 4, 10 and 29 Hz gave a particularly disturbing effect and the subjects felt quite giddy for several hours afterwards. HUM like effects with typical quasi-periodicity were also maximised for two tones one audio in the range 29-75 Hz one infrasonic wherein the infrasonic tone fell such that its third overtone was within 2Hz or so of the audio tone. The results of these experiments give very strong support to the notion that at least one component of the HUM is infrasonic and that it might never be possible to measure a single HUM characteristic or single per se in that the quasi-periodicity which subjects experience may well be an internal effect related to the latency periods of linear and non-linear products in hearing. Non linear acoustic products of the human cochlea are know to be of the form 2f1 – f2 at frequencies of the order of a few kilohertz (ref) but odd harmonic generation is known at lower frequencies ( ref) in line with the above result.
Alternatively, the more complex and pulsating behaviour for the HUM as actually observed seems to be consistent with a signal arriving via more than one medium or pathway. In this respect the Hum is known to have quasi-periodic fluctuations in amplitude anecdotally reported to be between 0.5 and 2Hz. Imagine a 10 Hz infrasound wave propagated by three media, namely; air, water and rock, at speeds of 330 m/s, 1500 m/s and approximately 5km/s. For in-phase coincidence on arrival times from a fixed source this yields a 1.66 second difference for the rock-air case or 0.6 Hz, a 0.5 second difference or 2 Hz for the water air case and a 3 Hz difference for the water rock case. Given that the attenuation coefficients of sound in all three media are different and may vary independently this would be sufficient to produce the amplitude pulsation effect experienced by Hummers. For example the seismic propagation of anthropogenic sound from turbines is known to change preceding and post earthquake due to changes in stress and strain in the planetary structure and rocks (Yakovlev and Aleshin 1994). This may account for anecdotal reports of people hearing the HUM louder before major earthquakes and its amplitude subsiding afterwards. The present subjects have certainly noticed this effect. One possible anthropogenic source involved in Wales could be the turbines at Dinorwig pumped storage hydro-power plant which are known to radiate at 8.33 Hz ( refs).
Moving vehicles also seem to momentarily attenuate the Hum at the authors’ residence whereas random noises inside the house do not. This effect is indeed ironic when some have said that the cause of the Hum itself may be more remote fast moving vehicles on motorways, see Rybak (2000) and Fox (1992). Vehicles produce broad band infrasonic noise in addition to narrower band engine noise. The Hum seems to have a dead time of up to 5 seconds after the passage of a vehicle. For example at 10 Hz this represents some 500 cycles of Hum. In Fourier domain technology this is about the number of cycles required to specify a coherent sine wave. Therefore it is tempting to suggest then that the body is coherently detecting the Hum in some way. Since these frequencies are close to those of natural alpha brain rhythms of the coherent oscillations of the thalamic pacemaker cells in the human brain (Brazier, M. A. B. (1970), The Electrical Activity of the Nervous System, London: Pitman) it is possible the brain may entrain at Hum frequencies. Feasibly, this might account for sensitisation or cancellation by other noise sources as reported by Deming (2004) or even experience of the same or similar sensations as a result of appropriately pulsed electromagnetic sources.
Movement of vehicles will also disrupt the propagation of both seismic and airborne infrasound on a local basis (Daigle 984). Also, turbulence in their wakes may produce an effect similar to the wind above. At the author’s residence such disruption seems to occur over about a 300 metre radius, consistent with a significant fraction of a wavelength of a bulk seismic wave at say 10 Hz and several wavelengths of the same frequency in air. From above it can be seen by simple calculation that when there are more than about 700 vehicles per hour the Hum will simply not be heard. At night there are far fewer vehicles. In a busy city there are often several thousand vehicles per hour even on side streets thereby minimising the chances of ever hearing the Hum.
It is feasible that the Hum has a seismic component of the Hum may propagate quite close to the earth’s surface. There are anecdotal reports on Hum forum websites of the Hum ceasing when the ground was loaded with several feet of snow which would have a pressure damping effect. Similarly there are reports of the Hum starting up again when the snow melted and vehicular movement re-commenced. Fox (1992) has actually suggested the vehicular movement might be the cause of the Hum. That vehicles on motorways emit surprising narrowband infrasound in two distinctive frequency bands has recently been shown by Rybak (2000).
Experiment 4 radio frequency enhancement
Since some have said the HUM is or may be electromagnetic in origin an experiment was performed to see if low frequency hearing is affected in the presence of radio frequencies. Many studies conclude that normal hearing is for instance totally unaffected by GSM cell phone signals. Continuous carrier wave excitations at frequencies of 7, 30, 50 and 144 MHz were employed with the subjects standing near indoor transmitting antennas with field strengths of …….Volts per metre. No acoustic effects were recoded with radio frequency only. For infrasound in the range 17- 30 Hz played monaurally all subjects reported a slight increase in the perceived amplitude in the right ear at transmitter frequencies of 50 and 144 MHz. The author alone noticed a slight increase in low frequency acoustic perception around 30 Hz in his ‘infrasound- deaf’ left ear. More and more people the world –over seem to be reporting sensitivity to the HUM and although at least one component of the HUM is infrasonic we have the strong possibility that electromagnetic emissions may be enhancing people’s low frequency hearing! It is interesting to note that the right ear has been described elsewhere as being most sensitive to radio frequency radiation (See at al). The present author hopes to report on relationships between radio transmitter sites and HUM sites at some stage in the future and also on other mechanisms by which infrasonic and acoustic sound and radio waves could interact.
Discussion of results and wider context of the Hum
The conclusion is that narrow band or monochromatic infrasound below 20 Hz is only found in locations where the subjects perceive the Hum would appear to corroborate the initial hypothesis. Further it would appear that at least for the subjects of this investigation the precise frequency of the infrasound is relatively unimportant provided it is relatively monochromatic and lies somewhere between 5-17 Hz. This also encompasses the range of human alpha brain rhythms. The presence of two monochromatic frequencies close together as at the author’s residence does not seem to significantly change the nature of the HUM as perceived.
Closer inspections of all the above spectra which show infrasound of less than 20 Hz (figures 1-7 and 9) have some amplitude variation as a function of time scales of the order of a second or so. Although these fluctuations are not dramatic, they may be sufficient to account for the pulsating nature of the Hum particularly given comments made by Moller and Pederson (2004) on how small changes in infrasound amplitude can dramatically alter perception.
Alternatively the quasi-periodic fluctuations people report as implicit in the HUM may be related to different internal latency periods in the audition process (ref).
In all but one of the spectra wherein the subjects reported the Hum, figure 1, there is also acoustic noise and a narrow band acoustic signal at or close to 32 Hz, coincidentally an acoustic frequency which some have associated with the Hum. It is possible this represents the third or fourth overtone or harmonic of a lower infrasonic component. Such components are known to be generated by non-linear seismic interactions in certain soil types (Pavlenko 2001). Indeed it would seem that a frequency around 32/33 Hz is very prevalent in the environment. There is reference to this being due to seismic harmonics from turbines (Yakovlev and Aleshin 1994) or to signals from fans, pumps and compressors (Cowan 2003) or from turboprop aircraft at 2000 rpm (Farokhi 1990).
Close to locations which are known to radiate infrasound on a regular basis the present subjects perceive the Hum in their car at any time of day or night whereas at home the HUM is mainly perceived at night after about 9 pm, throughout the night thereafter and in the morning until as late as 10 am. This is suggestive of either a local infrasound source which switches on and off at these times or equally suggestive of a more distant infrasound source being able to propagate into the author’s residence exclusively at night. It is known the sound propagated much better in the nocturnal boundary layer at night (Waxler 2003) and it is also known that two higher channels for atmospheric ducting of infrasound exist, one in the stratosphere and one in the thermosphere (Gibson and Drob). Due to the fact that infrasound from more distant sources also travels further at night, some light is now also shed on anecdotal reports of the HUM being a mainly nocturnal phenomenon.
It is hoped to report on sources of infrasound for the Hum and effects of the Jet Stream on the Hum in the near future.
Conclusions
1. The hypothesis that the HUM is both internal and external in that it depends on more than one external signal and processing of those signals by human audition has been strongly supported.
2. Using at least one in the infrasonic range can produce a ‘HUM like’ experience under laboratory conditions in certain experimental subjects.
3. Certain radio frequencies above 30 MHz appear to enhance low frequency acoustic perception in those subjects.
4. At least some subjects perceive the HUM as a result of their general enhanced sensitivity to infrasound.
5. The hypothesis and results fit in well with many anecdotal reports of the HUM and its properties.
6. The HUM as perceived by the present experimental subjects appears to be associated with at least narrow band infrasound in the frequency range up to 17 Hz, these frequencies are corroborated by both electronic measurement and wind speed measurement methods.
7. At most of the sites where the subjects heard the HUM, acoustic signals were also present, mainly broad-band, with the exception of a signal in the region of 32 Hz which seems prolific.
8. A possible explanation for the pulsating modulation of the HUM is advanced in terms of multi-path or multi-media HUM signals
9. An alternative explanation in terms of internal audition latency exists.
10. The HUM may be experienced very locally to a continuous infrasound source or at a distance when air -borne infrasound propagation is better at night; this explains why for some the HUM is mainly a nocturnal phenomenon.
11. Generation of infrasound in the air at the antenna or at passive inter -modulation interfaces by electromagnetic signals is not ruled out by this study but is not thought to be the main or only cause of the HUM.
12. The effect of moving vehicles probably accounts for why the Hum is rarely if ever perceived in large cities.
13. Modern electromagnetic technologies may be enhancing people’s sensitivity to the HUM.
Acknowledgments
The author wishes to acknowledge his wife Gwyneth for her patience during the preparation of the manuscript and to further thank his son Dwain and sister-in-law Marian for their contribution as experimental subjects.
References
3. World Sources of Infrasound for the Hum and the effect the Jet Stream has upon subjective Hum levels in North Wales, by Dr Chris Barnes.
Introduction
Sources capable of generating infrasound such as gas mains, factories and traffic have in the past been blamed for the Hum (Fox 1992). Such infrastructure expanded enormously in the UK between the 1960’s and 1980’s as Hum reports multiplied. Others have shed doubt on the infrasound hypothesis by suggesting that extremely low frequency radio transmissions from TCAMO (take charge and move out) military communications aircraft may be to blame (Deming 2004).
It has recently been shown experimentally that at least one infrasonic component below 20 Hz is involved in the HUM and further that HUM like effects can be synthesised and simulated using low frequency sound and infrasound. (Barnes 2007). This revives and reinforces the infrasound hypothesis. Barnes (2007) has further established, at least for certain subjects that the anomalous auditory phenomenon known as the Hum is due to monochromatic infrasound in the range 5-17 Hz is manifest when very local infrasound is present at appropriate frequencies, for example, as in the case of subjects listening when seated in a parked vehicle outside a pumped storage station or underneath wind vibrating power lines. However, it seems it can equally be manifest by propagation from a more remote source, which is more likely at nighttimes, when the majority of those afflicted seem to experience the Hum. The infrasound measured appears to be monochromatic and slowly pulsating in amplitude, thus it may be that when Hummers experience the Hum at home and at night, more than one source of infrasound is involved. Some sources of infrasound can travel many hundreds of kilometres, so ultimately it might not always be readily possible to trace the source for every single case of the Hum. However differentiation between most and least likely sources ought to be possible on the basis of their temporal, frequency and amplitude properties and upon their historical evolution compared with the time line in growth of the Hum phenomenon.
Sources of infrasound for the Hum
Sources of infrasound as possible causal pre-requisites for the Hum need either to be constant radiators or at least radiate a significant amount of the time, particularly at night, and possibly need to be capable of producing multi-path effects or use multiple propagation media to allow for the amplitude variation of the Hum. Mainly anthropogenic sources of infrasound fit this requirement, although some natural sources also radiate with surprising constancy. Existing over geological epochs and pre-dating even the existence of human kind, let alone their twentieth and twenty-first century experience of the Hum, natural infrasound would seem at first sight simply not to fit the bill, unless, that is, something is sensitising more and more of the population to infrasound in general. If on the other hand sensitisation were a distinct possibility then natural infrasound may be of relevance, it is hoped, perhaps to report on possible evidence which corroborates such a sensitisation hypothesis at a later date.
Anthropogenic infrasound from infrastructure is usually be expected to be generated at or close to ground level and is a possible candidate also allowing propagation into multiple transmission media, so would seem to be a more acceptable cause for infrasonic Hum, but does not readily explain anecdotal reports of the Hum being momentarily altered by the passage of passenger planes. Unless, that is, some of this infrasound is being propagated very large upward distances and is then re-reflected which has been shown to be the case (Mutschlecner and Whitaker 1990). This fact has recently been re-asserted by Krasnov et al (2005) and has been proven experimentally by Koshovvyy et al (2007). The propagation of infrasound to earth from a natural source, the aurora, is known to be affected by the jet stream (Johnson 1976). Indeed some are intentionally experimenting by projecting high power synthetic and monochromatic infrasound into the ionosphere (Rapoport et al 2003). The present frequency of such experiments and how they might affect Hummers is not readily known. Whatever the sound source injected, effectively several channels exist for propagating infrasound from the Hum. These are seismic (refs) and airborne. Of the airborne channels, one can exist in the night-time boundary layer (Waxler) and it is also known that a further two higher channels for atmospheric ducting of infrasound exist, one in the stratosphere and one in the thermosphere (Gibson and Drob). It may be that to produce the pulsating effect of the Hum propagation between the source and the hearer has to be through more than one of these channels, with associated phase delays between them.
Alternatively or additionally infrasound generated by planes themselves (Bedard Jnr. and Cook 1968) and (Crowley and Blaney 1987) or from their wake vortices ( Hardin et al 2004) may be involved as a cause of, or contributor to the Hum, which with the ever increasing expansion of air traffic can be seen is another distinct possibility. The recent vast growth in air passenger travel coupled with the use of aircraft with higher by-pass ratios which are known to generate more infrasound (Baklanov and Zayykin Paper 58) is thus a very feasible contributing factor in some parts of the World.
Land based anthropogenic sources of infrasound include; the power grid, power generation in particular hydroelectric and pumped storage (refs), cooling fans (Cowan 2003), compressors, chimneys, tunnels, suspension bridge structures, motorways (Rybak 2000) traffic (Fox 1992) and the gas grid (www.springerlink.com/index/Q6JH11813263UP67.pdf). Britain’s motorway network expanded significantly during the 1960’s about the time of the first significant Hum reports. Rybak (2000) has found two distinct groups of monochromatic frequencies to be associated with high speed traffic, the first between 0.5 – 1 Hz and the second between 5-8 Hz, the latter similar to those measured by the author at Hum sites, the former very similar to the anecdotally reported amplitude modulation rate for the Hum.
High pressure gas grids capable of generating infrasound pulsations close to 10Hz(Bell,PGIInternational)www.afms.org/Docs/gas/George_Bell_Pulsation_Paper.pdf now span much of Britain. Strictly speaking faster pulses from the system control valves about 100 Hz are modulated onto slower pulsations of between 0-50 Hz arising from the compressors. The example pressure waveform given by Bell looks not unlike those acoustic output waveforms from the sound amplifiers of Lennart Branthle portrayed in ‘report on the humming noise’ noise by Frank Moller. Branthle makes much of the acoustic signal at 76 Hz yet ignores the fact that its amplitude appears to fluctuate considerably at between 10 -12.5 Hz, i.e. that the signal has a clear infrasonic component. It is known that infrasound at these frequencies may be interpreted by sensitive individuals as higher frequencies during tone matching exercises ( refs).
The Tappan Zee Bridge was the first such structure recoded in the academic literature as a radiator of infrasound at a frequency of 8.5 Hz (Donn et al 1974). The first crossing over the river Severn near Bristol was completed in 1966. Hum reports in Britain and Bristol have been known ever since. In scaling the size of the Severn crossings accordingly, the author calculates that these ought to emit infrasound in the range 3.2 -5.3 Hz. considerably in number since the first cases of the Hum in the 1960’s and 70’s were reported.
Sound from the power grid is also an omnipresent source. Sections of the power grid are known to fluctuate in load and hence frequency and this could, potentially, produce beats or warbling over large distances. Although the UK power grid usually radiates at 100Hz, water droplets can cause sound radiation over a greater range of frequencies typically 14.8-160 Hz, see Roero and Teich (2004). The infra-structure of the UK power grid began to expand about the same time mass Hum complaints came to light in Britain. Power grid wires themselves also have several different wind driven acoustic vibration modes which can produce infrasound and acoustic sound from 1-150 Hz (Irvine 2006). If the Hum is not electromagnetic and not acoustic other than infrasound the other energy field mentioned in relation to the Hum is gravity (Dawes 2006/2007 website). Dawes has mentioned the possibility of 50 Hz power lines perturbing earth’s local gravity field and that the inner ear is sensitive to such perturbations. However, it is thought the inner ear is also involved in infrasound perception. Infrasound is also in abundant supply due to wind driven mechanical modes of power grid conductors. Power grid infrastructure in the UK expanded considerably in the 1960’s and 70’s. It is well known that power transformers along the power grid generate a fluctuating periodic component at double the power frequency fundamental with varying load (Keerthipala et al 1998). Power generation is itself, particularly in the guise of hydroelectric schemes because of the slow rotation speed of turbines, is known to be associated with long range seismic noise at infrasonic frequencies arising from turbines ( Hjortenberg and Risbo 1975 ), (Kvaerna 1990), (Yakovlev and Aleshin 1994), (Bockelman and Baisch 1999) and (Lui and Gao 2001). Diurnal effects have been noted in these seismic signals and it has been proposed they can reflect from the atmosphere. Similarly, there are of course many anecdotal reports of atmospheric and diurnal effects for the Hum. It is becoming more and more recognised that the lithosphere and ionosphere are intimately coupled and that power line emissions may affect the ionosphere (Sgrigina et al 2002). One also wonders if infrasound in the region of 10 Hz might be generated by non-linear effects between 50 Hz radiation form the UK power grid and 60 Hz from the US power grid given that such wave –mixing effects are possible in the ionosphere (Krasnov 2005).
More recently to appear on the scene are wind farms, particularly those with modern large, more slowly turning turbines. The infrasound from these has been shown to travel up to 10km under certain conditions. Elephant behaviour depends on their use of infrasound for communication and recent studies of this highlight the fact that even ground level generated infrasound in general can travel once it becomes airborne under appropriate weather conditions and at appropriate times of day and night (Garstang et al. 1995). Following such logic, indeed it has been recently recognised that wind farms can cause infrasound over extended periods of time in England and Germany (Haak 2007). This is perhaps hardly surprising in the UK, which already has 1774 active wind turbines spread between 139 separate wind farms (BWEA 2007). Furthermore the approximately 1Hz infrasound associated with these farms could be more of a problem than previously thought because it can modulate onto higher frequency sound creating a pulsating or periodic field. Could this in a sense be the pulsating modulation of some people’s Hum? Some 70% of locations, world-wide, which report the Hum are close to wind farms. Possibly a greater figure than this is indicated in Britain with Hum reports in Scotland, Wales and Cornwall, often being within a few tens of kilometres of wind farms. Differentiation however between a Hum based on noise entirely from Wind Power or Hydro-power may be difficult on a geographical basis because may of the sites almost co-exist, see http://www.r-p-a.org.uk/content/images/articles/1/BWind.JPG and http://www.r-p-a.org.uk/content/images/articles/1/hydro.JPG.
On land then, and in the UK it would appear that the great swathe of infrastructure completed during the 1960’s through to the 1980’s including motorways, suspension bridges, the high pressure natural gas grid, Scottish and Welsh Hydro-power and pumped storage schemes and a generally expanded power grid are all significant infrasonic radiators and thus could all contribute significant infrasonic frequencies to the Hum. Those seeking answers to the Hum in other parts of the world should perhaps look towards these British examples for guidance.
Many places where the Hum is experienced are in coastal regions. At sea, Large container vessels and tankers are know producers of anthropogenic infrasound of 7-33 Hz and low frequency noise (Arveson and Vendittis 2000) and indeed the background noise due to these has increased in some areas by several decibels over the last thirty or forty years (Andrew et al 2002). These ships and vessels then it would seem are also another very likely candidate for infrasonic contribution to an ever increasing catalogue of world Hum cases.
Other sea based sources of infrasound involve oil and gas exploration. Seismic surveys for this can give signals in the 10-60 Hz band and drilling rigs can produce infrasound around 5 Hz ( Gales 1982). The Hum has recently been reported on the South Coast of England close to such activities. Interestingly in the UK North Sea Oil first came on line in 1971 close to a time when Hum reports first started. Other sea based signals such as ATOC (Acoustic Thermometry of Ocean Climate) centred on 75 Hz , and SURTASS (The Surveillance Towed Array Sensor System) and LFAS (Low Frequency Adaptive )Sonar which are Naval Systems , are not likely to be directly associated with the Hum because it pre-dates them and they have higher acoustic frequencies in the range 50- 500 Hz.
It would seem then around UK coasts that oil exploration and exploitation together with increased infrasound form tankers and container vessels are the most likely sources of infrasound for the Hum.
For reasons given above it would seem easy to dismiss natural infrasound from having any part whatever to play in the Hum either as sole cause or contributory element. However, much natural infrasound is climate and in particular storm driven and will also propagate in the same channels available to anthropogenic infrasound. Some 90 % of scientists accept that the World’s climate is changing and that storms and high level winds often seem to have more ferocity in recent decades, so this leads to the possibility for substantially increased levels and episodes of naturally generated infrasound. Most of the known locations in the World where the Hum has been extensively reported are either coastal, near mountain ranges or near regular jet stream paths. Natural infrasound is often generated aloft. High altitude winds blowing over mountain ranges are know to generate quasi- stable infrasound in the frequency band .01 -10Hz ( Chimonas 1977), (Wilson and Olson 2003) and (Bedard Jnr. (2007)). Also nearly all the known locations where the Hum is reported are in areas whose air-space is prone to a lot of reported instances of so called clear air turbulence (CAT) http://en.wikipedia.org/wiki/ Clear-Air Turbulence. It has recently been shown CAT is associated with airborne infrasound generation in the frequency range 1-16 Hz (Posmentier 1973). Infrasound from parts of the Rocky Mountains where CAT is known to be a problem has been shown to be radiated with surprising constancy for periods of several hours at a time (Bedard Jnr. 2007), exactly the sort of criteria which meets the bill for a contributor to the Hum. Interestingly the Rocky Mountains span a huge part of the Western United States (http://en.wikidepedia.org/wiki/Rocky_Mountians where there are indeed extensive Hum reports (Allen 1995). (http:// www.eskimo.com/~bilb/frenrg/sara.txt). CAT has been reported in New Mexico very close to the famous Taos itself (Reiter 2005)!
It has also been stated that CAT can be probed either acoustically or by radar or by optical scintillation (Cowen 1998) and Nishiyama et al (2002). A coherence or correlation between scintillation and wind noise is known to exist (Matani et al 2002). This might account for the synaethesia- like, experiences of some Hum sufferers such as the Hum as being louder on moonlit nights or in early morning sunlight. The eye ball can also resonate to infrasound at appropriate frequencies (Tandy and Lawrence 1998). Similarly seismic infrasound could vibrate street lighting poles in urban areas and produce an equivalent aural -visual synergy.
Along with CAT comes mountain associated infrasound waves which have recently been shown to create hot spots in the ionosphere (Terradaily 2005). It is presently proposed that as the electron and ion density in the ionosphere responds in accordance with these hot spots, radio propagation will be affected and respondent ion acoustic waves could arise. A similar explanation is given elsewhere to account for the artificial manipulation of VHF radar echoes for the mesosphere (Chilson et al 2000). The same types of waves are also known to be associated with the aurora which can have infrasonic frequencies from 1-16 Hz (Procunier 1971). In this form, the ionosphere is another potential source of pulsating, if not continuous, infrasound. The aurora and aurora sub-storm events produce magnetic pulsations (Wilson et al 2005) which might be converted to sound in the plasma (Fomichev and Fainshtein 1980). Such sound has been previously theorised upon (Maeda 1963) and recently audio –recorded (Laine 2000), the latter being evidence that this sound can sometimes propagate to earth as infrasound. The propagation of such sound to earth is also affected by the jet stream (Johnson 1976). The jet stream being aloft is it least in support of the notion that part of the Hum might come from above. Indeed some are intentionally experimenting by projecting high power synthetic and monochromatic infrasound into the ionosphere (Rapoport et al 2003). It is not known with what frequency such experiments take place or how they might influence the Hum. Evidence of plasma pulsations has recently been measured at ground level in the form of longitudinal electro-scalar waves, which can also scatter radio waves. Artificial ELF, VLF ( Stubbe 1982) and ULF (Bosinger 2000) and (Belyaev et al 2004) can be produced by ionospheric heating facilities but only at a fraction of peak natural levels (approximately 1 pT or one thousandth in terms of peak disturbed magnetic field component) and so can probably be dismissed as major contributors to the Hum. Nevertheless, perhaps on a note of caution, it should be remembered that many of these experimental heating transmitters and Doppler sounders e.g. Eeiscat, Seljelvnes now operate up to 24 hours per day with powers of over 100MW and pre-date Haarp substantially.
Lightening, sprites and elves also produce random and transient infrasonic bursts, but perhaps not with such certainty and monochromatic frequency components as would be required by the Hum. Similarly meteors, bolides and meteoroids can generate infrasound, but again not at the frequency or regularity which would be required to contribute towards a general Hum phenomenon.
On land and at sea, volcanoes, storms and tornadoes produces natural infrasound (Al Bedard Chapter IX) but possibly not on such a regular basis as would be required for its regular contribution in the Hum processes perceived in the UK. The sea produces constant infrasound in the form of microbaroms with frequencies usually about 0.2 Hz, but this is lower than even the commonly reported modulation rate of the Hum. In coastal regions the sea also produces surf infrasound of up to 20Hz (Aucan 2006). Many places which report the Hum are located near sea coasts. Sand dunes are also a known source of sound and infrasound but have to be very dry, less than 1% water, to produce any significant sound (Trexler and Melhorn 1986). In damp Britain therefore, it is highly unlikely that sand dunes would be a contributing factor. However, Britain along with many other regions does have waterfalls which are known to generate fluttering infrasonic oscillations with laser- like coherent amplification (Casperson 1997). Recent planetary changes seem to be giving rise to the observation of undersea methane clouds. It happens that bursting clouds of undersea bubbles from these methane releases these are a particularly intense source of monochromatic infrasound in the 6-7 Hz frequency region (Pontoise and Hello 2002). Furthermore, such sound could propagate long distances via two channels, water and air because it has been shown that the water –air interface is surprisingly transparent at low frequencies (Godwin 2006). Such natural signals then could be yet even be another possible candidate for the Hum on the basis of the present investigation.
Finally, it should be noted that electromagnetic signals such as those of TCAMO and others as a potential source of some cases of the Hum is not entirely ruled out by this present hypothesis and study. The mechanism of the electrophonic interaction perceived here would be simply because such signals can generate sounds by means of passive inter-modulation or passive demodulation either directly at their antenna or due to non-linear effects at corroded metallic surfaces or vibration due to magnetic induction. Depending on the precise frequency and modulation frequency or data rate of such signals, generation of secondary infrasound is a possibility.
Jet Stream Experiments in North Wales
There have been many anecdotal reports of the Hum varying with the weather. In the UK most places afflicted by the Hum are in western coastal locations such a Scotland, Wales and Cornwall. These areas have prevailing westerly winds at low levels but are also influenced by high level winds. A convenient measure of these is the 300 mb Polar Jet Stream which usually travels across Britain from West to East in wintertime but tracks further to the North in summer. This summer (2007) the jet stream has been unusually far South for much of the time resulting in the devastating floods suffered by Yorkshire in June and by Gloucestershire in July. The present experimental subjects have noticed a correlation between the proximity of the 300 mb Jet Stream and their perceived Hum level. The data appending to this is plotted in figure 1
 Two
examples of jet stream maps supplied by the Californian Weather Server (CWRS)
illustrate these findings. Figure 2 shows an example on 10th August
2007 when the Hum was not present and Figure 2 shows an example on …….when the
subjects interpreted the Hum as a subjective level 10 or maximum.
Two
examples of jet stream maps supplied by the Californian Weather Server (CWRS)
illustrate these findings. Figure 2 shows an example on 10th August
2007 when the Hum was not present and Figure 2 shows an example on …….when the
subjects interpreted the Hum as a subjective level 10 or maximum.
Figure 2
Figure 3
In North Wales, the results appear to show a correlation between the subjective Hum intensity and the location of the 300 mb jet stream.
Discussion
One can conclude that the infrasound for the nocturnal Hum is either actually generated by the jet stream or least transmitted by it in some way. High level winds existed prior to the 1960’s when the very earliest Hum reports in Britain were filed, so this tends to preclude the generation mechanism. Natural infrasound such as that of the pulsating aurora can be transmitted to earth by the jet stream (refs) but would not occur with such regularity to account for all cases of the Hum. Some new powerful sources of undersea natural infrasound (methane clouds) have, however, recently been observed. Lithosphere atmosphere coupling could, conceivably transmit this sound. Alternatively, one could conclude that the generator of the infrasound is so powerful that it could influence space weather and hence indirectly through ionosphere/atmosphere coupling affect the postion of the Jetstream. A sort of ‘cart before horse’ situation. Influence of power systems on the Hum and space weather will be discussed elsewhere.
However, by far the most prominent newly expanding sources of anthropogenic infrasound to the west of Britain are shipping (super tankers and the like) and aviation. Both shipping (refs) and newer designs of aircraft (refs) are very capable of producing infrasound with a regularity which could account for the Hum. In the case of shipping, sound propagation would involve lithosphere atmosphere coupling (refs) whereas in the case of aviation, leaky atmospheric ducts at more than one height may be possible (refs).
The only other possible explanation for nocturnal infrasound in the Hum may be near vertical incidence reflection of anthropogenic sound from infra- structure some how involving the jet stream. The most powerful anthropogenic source of infrasound in North Wales is possibly the Dinorwig Pumped Storage Hydroelectric plant which ought to emit at frequencies of 8.33 Hz (refs). Two or more channel sound propagation could be involved also involving seismic signals in the earth’s surface.
Alternatively some sort of anthropogenic sound generation in the lower layers of the ionosphere which move closer to earth at night? In this respect Haarp (High Altitude Atmospheric Research Programme) is capable of generating ion acoustic waves but the Hum pre-dates it by some twenty or thirty years. Similar projects to Haarp did however, commence in Scandinavia and the former Soviet Union about the time of the Hum in Britain and have transmitters still operational today. The jet stream is capable of transmitting auroral sound (natural ion acoustic waves) so maybe the same is possible of anthropogenic ion acoustic waves.
Unless vast resources were spent, possibly involving several of the World’s infrasound monitoring stations, the true source of the Hum may remain a mystery, nevertheless those sources most likely in a particular area can be evaluated by a process of elimination. Sadly, in the meantime many of those afflicted by the Hum continue to suffer in other peoples’ silence! Perhaps as more and more countries begin to take the potential hazards of infrasound and low frequency noise as seriously as Japan ( ref), resources will eventually be found for abatement.
Conclusions
1. Provided the infrasonic source(s) of the Hum has/have the necessary constancy and frequency component(s) it they are most likely anthropogenic but the possibility of natural sources cannot completely be ruled out.
2. Propagation into the higher atmosphere either from above or below possibly explains aircraft effects, but they themselves are an additional or alternative infrasound source
3. To satisfy the frequency spectra observed here as candidates involved in the Hum, the most likely natural infrasound sources are Mountain Generated Waves, CAT generated waves, Auroral infrasound and undersea Methane release generated waves.
4. Similarly to satisfy the observed frequency ranges, the most likely land based anthropogenic sounds have sources such as Hydroelectric Turbines, Motorways, Suspension brides and the Gas and Electricity Grids.
5. The most likely sea based anthropogenic sounds could arise from large container vessels and super tankers and oil rig drilling operations.
6. Diurnal effects of the Hum might be accounted for by reflection in the nocturnal boundary layer
7. Alternatively diurnal effects may be accounted for by load on the power grid or load on generator motor turbines in pumped storage systems
8. Alternatively again diurnal effects may be due to shifting height of the ionosphere transmitting ion acoustic waves via the jet stream
9. The jet stream has been shown to have a strong effect on perceived Hum levels in North Wales and is known to be an important acoustic ducting channel
10. In North Wales infrasound from aircraft and ocean going vessels might add to the Hum as infrasound transmitted by the jet stream
Paper Number 4. Active Prediction of Sites Prone to the HUM by Aharonov- Bohm Criteria
CHRIS BARNES
Bangor Scientific Consultants, Llwyn Heulog, Ffriddoedd Road, Bangor, Gwynedd LL57 2TW , Wales, United Kingdom
Email doctor.barnes@yahoo.co.uk
Abstract - Active prediction of locations most likely to experience the electro-acoustic effect known as the HUM are made and confirmed using criteria derived from the electromagnetic Aharonov-Bohm effect. The HUM is also proposed to be a non-linear bio-acoustic effect linking acoustics, electromagnetism and quantum biology. That is to calculate predetermined distances from known transmitter masts where magnetic A potential and B -field would be expected to have between them odd integral numbers of pi/2 phase difference on the basis of transmission frequency and propagation path. Types and frequencies of UHF transmission likely to produce the most intensive HUM in an area in conjunction with a strong medium wave field and relevant infrasonic components are also identified. Supporting evidence of the HUM as a coherently detected bio-effect possibly involving biological Josephson junction type behaviour is also presented.
Introduction
Sensitive individuals who experience the HUM extensively number in estimate some 2-11% of the population. The HUM has been heard in parts of the UK since around 1970 and in the USA since the early 1990’s. An excellent review of the history, occurrence and some alleged causes of the HUM phenomenon has been given recently by (Deming 2004). While the present author in agreement with Deming, comes to the conclusion that the HUM has some sort of electromagnetic connection, he doubts however Deming’s exotic conclusion concerning TACAMO transmissions are the general cause of the HUM, instead preferring the notion that they may only be a small part of the HUM ‘jigsaw’ puzzle and has recently produced strong evidence to suggest that the HUM is caused by the presence of at least two infrasonic sources or one infrasonic source and one low frequency sound source of almost harmonically related frequency. (Barnes 2007). Also shown was the fact that low frequency and infrasonic hearing in certain subjects seems to be enhanced in the presence of radio frequency carriers at frequencies greater than 30 MHz. There has been much recent expectation that GSM frequencies namely 900 and 1800 MHz might cause harm to human hearing yet all studies seen by the author have concluded no significant effect (refs). It is interesting not that the converse may be true and that hearing sensitivity may, in fact, be enhanced by certain electromagnetic fields. Sadly this is not much consolation for HUM sufferers. The HUM is heard in cars and in Faraday cages wherein the electric field vector of electromagnetic signals cannot readily propagate any influence of such signals must therefore arise from magnetic component (s).
Deming (2004) has stated that the HUM was first perceived extensively at night in Britain in the early 1970’s. Coincidentally, UHF TV was first introduced in Britain in 1967 and became extensive in the early 1970’s. Prior to that transmitters ran a ‘test card’ until about 12-40 am and then they were switched off all night. Other sources of radio frequency radiation such as PMR was extensively on low band and high band VHF and so a relative state of electromagnetic quiet existed at night. In the USA, a much larger country, UHF Television was invented in the late 1950’s but with much larger counties and larger transmission path distances to cover Low Band VHF and cable services predominated for National television until the advent of extensive satellite and Local UHF broadcasting, which really only took off in the early 1990’s. Every major town and city in the USA soon got local UHF broadcasting and Cellular phone technology began advancing and turning digital at about the same time. This is when most complaints of the HUM began in the USA.
A re-investigation of HUM sites world-wide seems to indicate that the vast majority are located within 10km of high power medium wave radio transmitters often with co-sited VHF FM broadcasting facility and within similar or closer distances to a source of UHF or microwave emissions. From an initial experiment, it would appear that the radio frequency field strengths which appear to enhance the infrasonic HUM appears to be significantly lower than those required for microwave hearing by thermo-expansion or similar mechanisms (refs). It is possible that bio-detection or rather bio-enhancement of the HUM is as a result of coherent action of bio molecules or living cells as defined by the remit of quantum biology. Some useful background information on quantum biology has been given by Massey and Fraser (2003). Another possibly is direct interaction with bound and free water molecules associated with proteins, organic molecules and other structures in the body, see Ho (2005) and also Sebastian et al (2001). To quote the proponents of an emerging Science and Technology then, the HUM may be regarded as a manifestation of a so called ‘Subtle-field’ or ‘Subtle –energy’ energy effect (Srinvasan 1999). Although factories and roads and various other forms of infrastructure known to emit infrasound have existed for decades, there are just a few anecdotal reports of strange hums dating back earlier than the 1970’s, indeed earlier than the history of radio and it is quite probable that these may have had their origins in natural electro-acoustic sources such as the aurora, meteoric fireballs and inter-stellar microwaves (Deming 2004). After the 1970’s the use of electromagnetic technologies, particularly at UHF and microwave frequencies, has proliferated enormously. This seems to have gone hand in hand with more and more reports of the HUM. If the HUM were purely infrasonic it would have been heard near coasts and mountains since the earliest of times yet reports in history although reporting Aeolian effects do not describe them as the HUM we know of today. Similarly infrasound ought to be very pervasive yet HUM cases from famous outbreaks such as Kokomo and North Shore New Zealand look almost random when plotted on the map. It was decided them to try and establish if there were any distance related effects between HUM sites and radio and TV transmitters.
Distance Related Effects
near Radio and Television Transmitters
Over the last two decades, as the use of radio communications has expanded faster than ever before there have been equally increasing concerns about its general safety.
The number of HUM reports World wide seems to have mirrored this increase although there are comparatively few reports in big cities (Deming 2004). The present author has provided explanations for this in a previous publication (Barnes 2007). Other strange effects such as sleep disturbances have also been reported as being associated with mobile telephone transmitter installations. There is a phenomenal body of literature, too extensive to review here, some of which is quoted by Henry Lai of energyfields.org to suggest that bio-effects, often non- thermal, due to electromagnetic radiation are very real and significant, and lead to physiological consequences for individuals from the mild to the chronic and even severe such as carcinogenesis, for example. Because of and in addition to such findings, epidemiological studies ( Dolk 1 Sutton Colfield (1997), Dolk 2 All of UK (1997), Cherry (2000), Michelozzi (2002), Ahlbom et al (2004) and Wolf (2004), have also been made, mainly of cancer in individuals living close to various broadcast transmitting facilities. One such study in the Vatican City has shown an increased risk of leukaemia associated with proximity to medium or short wave a.m. broadcasting transmitters up to a distance of 6km or so ( Michelozzi 2002). A very well known study around the Sutton Coldfield transmitter in the English Midlands region concluded there was an increased risk of various cancers within 2km of the Sutton Coldfield TV Transmitter (Dolk 1(1991)) but this result may have been complicated by the fact that the site has both UHF television facilities and equally high powered VHF FM facilities on the same antenna mast.
A second larger study of
more transmitters throughout the UK by Dolk et
al.,(1997) (Dolk 2) was concerned with, findings
for adult leukemia, skin melanoma, and bladder cancer near twenty high power
radio and TV transmitters in Great Britain other than the Sutton Coldfield transmitter previously studied.
It concluded that, “….while there is evidence of a decline in leukemia
risk with distance from transmitters, the pattern and magnitude of risk
associated with residence near the Sutton Coldfield
transmitter do not appear to be replicated around other transmitters. Indeed in
the Dolk 2 (1997) study the incidence in the risk of
leukemia in particular seemed to be a maximum 15% higher than expected at
distances in the range 2-10 km from transmitters but actually equal or lower than
this at distances closer than 2km. Cherry 2000) in a study of the Sutro TV Transmitter, San Francisco and others have
explained these findings elegantly in terms of radio frequency field effects
relating to the side and main lobes of television and radio transmitting
antennas. The Dolk studies (Dolk
1 &2 (1997) and their findings appeared to be at odds with the opinions of
local residents, which, having being communicated to Smith, prompted him to
re-examined it in the simplest manner so far as its published data allowed in
Electromagnetic Hazard & Therapy (Best, 2001).
Smith and Best (2001) re-examines the combined data from both Dolk1 (1997) and Dolk 2 (1997) studies and explains that since the Study covered 20 transmitters from different parts of the UK, it is reasonable to assume that any effects related to geographical or topographical features and antenna design should average out. He believes this only leaves the physical characteristics of the propagation of electromagnetic radiation from which to seek a mechanism. He reaches the conclusion
that when all the data is considered there is a highly significant peak in cancer incidence at on average some 5 km from the transmitter masts giving an observed to expected ratio of up to two fold. In following Smith’s logic, we must not loose site of the fact that most British UHF TV transmitter masts are co-sited with high power VHF FM facilities.
In seeking potential novel and new mechanisms to explain subtle energy bio-interactions, Smith (2001 and 2004) and others (Pitkanen 2006) have recently discussed water memory effects not only with regard to homeopathy but with regard to radio –frequency imprinting as well. A simple experiment involving a toroid and solenoid connected in series shows that when the magnetic A –potential and magnetic field vector- B are in opposite directions (180º or p/2 phase difference) the frequency of the current is imprinted into water placed nearby. When the A-potential and B field are parallel (zero phase difference) the frequency imprint is erased. Smith (2001) sees carcinogenesis associated with electromagnetic fields (and potentials) as a subtle bio-effect related to the Aharonov-Bohm effect first described in 1959. More recently it has been shown by van Vlaenderen (2001) that for electromagnetism the generalised Maxwell equations also contain scalar field terms which predict the existence of so called longitudinal electro-scalar waves in the vacuum which have an associated power flow term. Evans (2004) has stressed the possible importance of the Electromagnetic Aharonov-Bohm effect in radar and signalling technologies and is convinced that the effect is responsible for certain effects of radio frequency radiation on animal and human physiology. Additionally, if Batteaus’ (1968) hypothesis on nerve function proves correct, then the magnetic A –potential with its ability to perturb electron wave function at a distance may be able to directly influence nerve and brain tissue.
The present author also agrees that the results as re-evaluated by Smith certainly appear to bear some kind of a manifestation of the electromagnetic Aharonov –Bohm effect. For instance, the electromagnetic radiation (E- and B-fields) from a transmitter will experience refractive index and propagate at the velocity of light in air, but the magnetic vector potential-A (A-field), following the Aharonov-Bohm effect, does not interact with matter (instead it alters the phase of the electron wave-function) and so propagates at the vacuum velocity of light. At 5 km distance from a 100 MHz VHF FM transmitter, there will thus be a transit time difference of 5 ns between the A and B fields, based on standard values for the dielectric constant and refractive index of air. At 100MHz, this distance or time delay represents a 180º or pi/2 phase difference. This would be the ideal condition for that frequency to be imprinted into any water present such as living tissues. The frequency band 70MHz-130MHz would cover the standard deviations in Smith’s data as plotted. In the UK VHF FM broadcasts can be made anywhere within the band 88-108 MHz. At the other end of the frequency scale, there has been talk of restricting the power output of some medium wave transmitters such as the one at Anguillara-Sabazia (Italy) in response to pressure from the government on the basis of a ‘thermal effects’ hypothesis from “classical physics”. On the basis of Smith’s findings and the work presented here that would seem rather pointless.
Smith (Electromagnetic Man, Chapter 11) has further stated that possible bio-medical effects of the FM transmissions should include stress by entrainment of the allergy acupuncture meridian (AD1 in Voll-notation) which has an endogenous frequency of 94 MHz. As with power lines, there should be stress from chronic exposure to the ‘proving-symptoms’ for whatever homoeopathic potencies happen contain in this case, frequencies in the region of 100 MHz.
Extension of Aharonov-Bohm hypothesis
The hypothesis presented by the present author is that it should be wholly reasonable to expect Aharonov –Bohm type bio-interactions not only at pi/2 phase difference between A and B but also at odd integer multiples of this phase difference as well.
Cherry (2000) has analysed the incidence of all cancers, brain cancer and leukaemia around the Sutro TV tower. In his findings he concludes that cancer clusters coincide well with the radial distances of the antenna lobes. However if one looks at the positive residual variances in the data over and above those expected on a straight linear decrease in cancer probability with distance from the transmitter, (Cherry (2000), figure 11) it can be seen that there are significant increases in all cancers at distances of .9 ,2.6 , 4.3 and 6.3 km from the transmitter. The actual UHF channels in use at the Sutro transmitter mast are UHF 32, 44, 60 and 66 corresponding to a minimum frequency of 560 MHz and a maximum frequency of 834 MHz. On the basis of expectant peaks in bio-interaction, in this case carcinogenesis, one would expect families of peaks in cancer incidence to occur at distances form the transmitter mast corresponding to odd integer multiples of pi/2 phase between A and B at the working frequencies. A working frequency of 834 MHz yields expected peaks for the first, third, fifth and seventh integer multiples at distances of .89, 2.67, 4.45 and 6.29 Km from the mast. A working frequency of 560 MHz yields distances of 0.6, 1.8, 3.0, 4.2 and 5.4 Km. The data show a positive residual in the region of .9 km which is not explained by the antenna characteristic alone, Cherry (2000) makes no comment on this. It can be seen by the argument presented here that this residual has as its most likely origin the Aharonov-Bohm type electromagnetic bio-effect with A and B exactly pi/2 out of phase at 834 MHz. Moreover, Cherry suggests the residual in the data which peaks at 4.3 km is due to the antenna lobe at 4.5 km whereas a more accurate picture is obtained by considering the mean of distances 4.2 and 4.45 Km predicted above. The data also show a clear peaking positive residual at 6.3km which Cherry attributes to the antenna main lobe at exactly 6 km distant from the tower. However, a more accurate fit can be obtained by considering the influence of the seventh integer Aharonove –Bohm electromagnetic bio-effect associated with 834 MHz signal which peaks at exactly 6.29km from the transmitter. Generally the 834 MHz transmitter seems a more effective source of carcinogenesis than does the one of 560 MHz frequency. Interestingly Smith has stated that the Ren 24 acupuncture point on the Ren Mai meridian will entrain at a frequency of 730 MHz and up to 920 MHz but from his data it does not appear to do the same at frequencies as low as 560 MHz.
Also the natural resonant frequencies of the water molecule at 1.42 and 2.65 GHz are both significantly closer to direct harmonics of the 834 MHz frequency than to those of the 560 MHz frequency.
Method for Active Prediction of HUM locations
So striking are the above results for an interpretation of electromagnetically induced bio-effect in cancer epidemiology, it was decided by the present author to see if the same type of logic could be applied for the actual active prediction of HUM locations. That is to predict exactly where on the map the HUM would be likely to be perceived the loudest, and where, perhaps, it ought not to be perceived at all or at least weaker, in that the present hypothesis is that the HUM too is proposed to be a non-linear bio-acoustic effect somehow linking electromagnetism and quantum biology. The strategy for such prediction is to calculate predetermined distances from known transmitter masts where the magnetic potential (A-field) and magnetic field B would be expected to have between them odd integral numbers of pi/2 phase difference on the basis of transmission frequency and propagation path. The method is simply to make the calculation according to Smith considering that the B-field is affected by the refractive index and dielectric constant of the propagation path whereas the A-field propagates in the vacuum at full light speed. The distances, calculated from several transmitter masts including one TETRA, two GSM 900MHz, one GSM 1800 MHz and a UHF TV transmitter with co-sited VHF FM and DAB, were marked as radial circles on an ordnance survey map and a number of sites conveniently accessible by road were selected on that basis alone.
In all 7 sites were selected where A and B would be expected to fulfil the required pi/2 out of phase requirement with respect to the TETRA transmitter, and a further five where A and B would be expected to be 3pi/2 out of phase.
Five sites were selected which would be expected to produce the pi/2 relationship for
GSM900 and a further three sites to produce the 3pi/2 relationship. A further three sites were selected on the basis of the 3pi/2 relationship for a GSM1800 MHz transmitter. It was not possible to get close enough to the transmitter mast by car to facilitate the much shorter pi/2 distance since the former was located in an open field. A further seven sites were investigated on the basis that they were located such as to give integral numbers of pi/2 ranging from 9-13 in respect of the 100KW UHF TV installation at Llandonna on the island of Anglesey. In choosing each site, care was taken to make sure the local geography was such as to exclude, as much as practically possible, signals from other UHF and microwave sources. Such a practical assessment and study is only possible in a semi-rural region like North Wales because many areas are already very heavily populated with broadcasting and communications towers of all kinds. All the sites were within 15km or closer to the 10KW Radio Wales 882 KHz medium wave transmitter, and it should be noted that for this transmitter and at this distance there would be minimal phase angle between the A-potential and the B-field.
Finally a further three sites were chosen with a random phase relationship for all the transmitters concerned whilst trying to ensure that at least some of these sites would still be line of site with some or all of the transmitters yet not present any of the above odd integer phase relationships.
The UK ordnance survey six figure grid references for each site and the transmitters used were recorded. All the locations are to be found on ‘Landranger’ ordnance survey map sheet number 115, namely Snowdon and the surrounding area.
The transmitter location grid references were as follows:
TETRA; 579711
GSM 900 (1); 570718
GSM 900 (2); 579711
GSM 1800; 581712
UHF TV; 583806 (Co –sited with VHF FM and DAB)
AM 882 KHz; 632805
Experiments
All the experiments were performed on the same night in January 2007. The weather conditions were calm and dry and the temperature was about 7 Celsius. The HUM could be heard at the author’s home address before embarking on the car journey to collect the experimental recordings. Both the author and his wife are sensitive to the HUM and both agreed on subjective HUM levels at the various locations on a scale of 0-10, 0 being equivalent to no HUM level discerned ranging to 10 being ‘ear splitting’ or extremely unpleasant HUM and equivalent to the loudest either had ever perceived the phenomenon in the past. All the experiments were performed by manually recording the perceived level in a parked car with the engine off. The type of car was a Vauxhall Astra 1.8, 2002 model. At locations where the HUM level was low i.e. 4 or under on the perception scale the author and his wife waited for at least 20 seconds to see if there was any variation in the HUM level. No recordings were taken in the vicinity of passing vehicles which disrupt the HUM by both background noise interference and signal scattering which causes Doppler shift and reduced coherence. The recorded results were transferred from a paper log in to an XL spreadsheet on returning to the author’s residence.
Results
The results obtained are shown in Table 1 below.
|
Map reference |
A/B Phase relationship |
Transmitter |
Subjective Hum strength 0-10 |
Comment |
Normalised |
|
|
|
|
|
|
|
|
573719 |
180 DEGREES |
TETRA |
10 |
LOS |
|
|
578727 |
180 DEGREES |
TETRA |
10 |
LOS |
|
|
586726 |
180 DEGREES |
TETRA |
10 |
LOS |
|
|
593717 |
180 DEGREES |
TETRA |
8 |
NLOS |
|
|
591706 |
180 DEGREES |
TETRA |
8 |
NLOS |
|
|
583700 |
180 DEGREES |
TETRA |
8 |
LOS |
|
|
568706 |
180 DEGREES |
TETRA |
7 |
NLOS |
|
|
|
|
|
|
|
|
|
AVERAGE |
|
TETRA |
8.71 |
57% LOS |
15.2 |
|
|
|
|
|
|
|
|
618712 |
540 DEGREES |
TETRA |
10 |
LOS |
|
|
614697 |
540 DEGREES |
TETRA |
10 |
LOS |
|
|
607687 |
540 DEGREES |
TETRA |
4 |
NLOS |
|
|
598680 |
540 DEGREES |
TETRA |
10 |
LOS |
|
|
548692 |
540 DEGREES |
TETRA |
10 |
LOS |
|
|
|
|
|
|
|
|
|
AVERAGE |
|
TETRA |
8.8 |
80% LOS |
11 |
|
|
|
|
|
|
|
|
|
|
|
|
|
|
|
577715 |
180 DEGREES |
GSM 900 |
6 |
NLOS |
|
|
573713 |
180 DEGREES |
GSM 900 |
6 |
LOS |
|
|
584706 |
180 DEGREES |
GSM 900 |
8 |
LOS |
|
|
568706 |
180 DEGREES |
GSM 900 |
8 |
LOS |
|
|
573719 |
180 DEGREES |
GSM 900 |
10 |
LOS |
|
|
|
|
|
|
|
|
|
AVERAGE |
180 |
GSM900 |
7.6 |
80% LOS |
9.5 |
|
|
|
|
|
|
|
|
591718 |
540 DEGREES |
GSM900 |
9 |
LOS |
|
|
588720 |
540 DEGREES |
GSM900 |
6 |
LOS |
|
|
565708 |
540 DEGREES |
GSM900 |
6 |
LOS |
|
|
|
|
|
|
|
|
|
|
|
|
|
|
|
|
AVERAGE |
540 |
GSM900 |
7 |
100% LOS |
7 |
|
|
|
|
|
|
|
|
|
|
|
|
|
|
|
585713 |
540 DEGREES |
GSM1800 |
6 |
LOS |
|
|
568706 |
540 DEGREES |
GSM1800 |
8 |
LOS |
|
|
571713 |
540 DEGREES |
GSM1800 |
4 |
LOS |
|
|
|
|
|
|
|
|
|
AVERAGE |
540 |
GSM1800 |
6 |
100% LOS |
6 |
|
|
|
|
|
|
|
|
|
|
|
|
|
|
|
588716 |
ODD MULTIPLE 180 DEG |
UHF TV |
8 |
LOS |
|
|
579715 |
ODD MULTIPLE 180 DEG |
UHF TV |
6 |
NLOS |
|
|
574716 |
ODD MULTIPLE 180 DEG |
UHF TV |
6 |
NLOS |
|
|
573719 |
ODD MULTIPLE 180 DEG |
UHF TV |
10 |
LOS |
|
|
567717 |
ODD MULTIPLE 180 DEG |
UHF TV |
4 |
LOS |
|
|
555718 |
ODD MULTIPLE 180 DEG |
UHF TV |
8 |
NLOS |
|
|
544726 |
ODD MULTIPLE 180 DEG |
UHF TV |
10 |
LOS |
|
|
|
|
|
|
|
|
|
AVERAGE |
|
UHF TV |
7.4 |
57% LOS |
13 |
|
|
|
|
|
|
|
|
|
|
|
|
|
|
|
597710 |
RANDOM |
NO LOS |
0 |
|
|
|
605706 |
RANDOM |
NO LOS |
2 |
|
|
|
557712 |
RANDOM |
NO LOS |
0 |
|
|
|
557704 |
RANDOM |
LOS ALL |
0 |
|
|
Column 1 of the table merely shows the o/s grid reference of the experimental location. Column 2 shows the phase relationship between the A-potential and the B-field at each location. Column 3 shows the transmitter type for which each location was optimised. Column 4 shows the subjective perceived HUM strengths at each location together with the average HUM strengths across each particular location type. Column 5 is the comment column; LOS standing for line of sight communication path with the chosen transmitter mast and NLOS standing for not line of site. Column 6 shows the subjective HUM level obtained as a result of re-normalising the average levels to take out imbalances in the data caused by none line of site propagation paths.
It can be seen that all sites with a pi/2 or npi/2 phase relationship between the A-potential and the B-field for their chosen transmitter manifest the HUM to a greater or lesser degree, exactly as predicted by the initial hypothesis. Further it can be seen that subjectively, TETRA and UHF television have the largest potential to give rise to the HUM followed by GSM900 mobile phone base stations, followed least of all by GSM1800 base stations, see figure 1. It can also be seen that subjective HUM levels are not dependent on UHF field strength. For instance going from a pi/2 to a 3pi/2 criterion as defined above trebles the distance from the transmitter. For such an increase in distance, classical electromagnetism would predict a fall in field strength to 1/9th its original value, yet the subjective HUM level only falls to .72 of the original for TETRA and .86 of the original for GSM900 over this trebling of distance from the respective transmitters. It can further be seen that sites which do not satisfy the Aharonov-Bohm criteria have either no or minimal potential to cause the HUM, even in the case where they are in direct line of site with all the above transmitter installations.
Interfering frequencies
An attempt was made to see if interference from nearby frequency sources could modify the HUM. A 100mW 49MHz source caused a miniscule reduction in the perceived HUM amplitude when capacitively coupled directly to the author’s outer ear. A 144 MHz 1 watt source made no difference whatsoever. A 446 MHz 100mW PMR source caused a minute increase in the perceived HUM magnitude.
Confirmation of most likely mechanism for HUM hearing
As previously discovered (Barnes 2007) perception of the HUM requires very specific infrasonic frequencies. Quantum biological effects would be expected to require very specific magnetic field strengths and it is not surprising, therefore, interfering signals even at considerable local field strength have little discernable effect. Some contemporary scientists view certain protein and nucleic acid segments of biological cells and organelles as being room temperature superconductors and therefore capable of, under appropriate circumstances, Josephson junction type behaviour (Del Guidice et al 1989 and Smith 2004). Classical Josephson junctions are used in SQUID devices for the detection of brain wave magnetism and also for microwave detection and for detection of Curl-free magnetic vector potential fields (A-fields), indeed there are several US patents on this use. An a.c. Josepson junction acts like a perfect voltage to frequency converter (or the converse) and so it might demodulate a frequency or amplitude varying A –potential. Taken with the weight of evidence above ,in particular maximisation of the HUM phenomenon at odd npi/2 phase differences between A and B for a given transmitter the results give some support to the most likely mechanism of HUM hearing as coherent bio detection. It has not been possible from this experiment to localise the precise place of bio detection.
Direction of the HUM
It is impossible for individuals affected to sense the direction of the HUM. The perfect omni-directional transmitting antenna is the theoretical isotropic radiator. The converse is true of a receiving antenna. If single cells or even cellular clusters are responsible for the bio-detection of the HUM they are far tinier than a wavelength and would therefore be expected to act as isotropic. When the HUM amplitude is quite weak it is sometimes necessary to turn the head a couple of times before it can be discerned. It is interesting to note that Smith (2006) has mentioned that tapping, shock or shaking is needed when radio-imprinting water and comments that clearly something unusual is happening in space and time in order to facilitate this requirement. Maybe turning of the head does something similar to bio fluids in the brain or hearing apparatus.
Conclusions
The present work shows the following conclusions:
1. An electromagnetic Aharonov-Bohm criteria used previously by Smith for imprinting electromagnetic frequencies in water memory and to highlight epidemiological findings of cancer clusters around television transmitter installations, namely that the phase difference between the A-potential and the B-field should be pi/2 may be extended for the purpose of epidemiology prediction to cases where the phase difference becomes npi/2 where n is an odd integer.
2. The same type of phase criteria as in (1) above have been used here successfully to predict precise locations where the phenomenon known as the HUM will be experienced and maximised for a given UHF/microwave transmitter frequency in the presence of a background medium wave field and infrasonic fields.
3. The type of 400 MHz digital transmission known as TETRA would seem, at least subjectively, to have the most capacity to cause the HUM. This is followed by UHF TV 500-800MHz, GSM 900MHz and finally by GSM 1800 has least capacity to cause the HUM.
4. Subjective perception of the HUM is a non-linear coherent bio-effect at points with UHF/microwave field of an appropriate A-B phase relationship does not seem to follow the normal inverse square law of electromagnetic attenuation. It should be remembered however that a strong coincident medium wave field is also required for the perception of the HUM and in this respect all of the locations were only a few tens of wavelengths away from the 882 KHz (lambda = 340m) medium wave transmitter at Penmon, ngr 632805.
5. Coherent detection/augmentation of the HUM might involve biological equivalent of a Josephson junction(s).
Implications and the future
The implications of this study and the previous one of the author (Barnes 2007) to the general public, planners and users of the radio frequency spectrum are immense. Doubts have been raised in the past concerning the simplistic approach that it is only dangerous to be within the near field or at least very close to say within a few tens metres at the most of a UHF/ microwave transmitting antenna. This study has shown that the acoustic electromagnetic bio-effect known as the HUM is enhanced in locations and at field strengths not previously thought to be in any way hazardous. At the very least, the HUM is a nocturnal nuisance; at most, sites wherein it is perceived might even for other reasons constitute dangerous bio-hazards. In the meantime we should err on the side of caution and reduce power levels of all broadcasting and communications facilities to an absolutely practical minimum. Mobile telephone receivers for example are capable of working at field strengths of as little as 1/10,000 of those currently employed. Armed with this type of information in the future transmitter site planners and even general building town and country planners will have more idea how to locate buildings and transmitters to minimise bio-effects such as the HUM. It may be that in future as the quantum biological manifestations of the acoustic-electromagnetic interaction become better understood that certain specific frequencies and modulation schemes will also have to be avoided.
References
Aharonov Y and Bohm D 1959 Significance of electromagnetic
potentials in the quantum theory Phys. Rev. 115 485-91
Ahlbom, A., Day, N, Feychting, M., Roman, E.,
Skinner, J., Dockerty, J., McBride, M., Michaelis, J.,Olsen,
J. H., Tynes, T., Verkasalo,
P. K. 2000. A pooled analysis of magnetic fields and childhood leukaemia, Brit. J. Cancer, 83(5): 692-698.
Barnes,C. 2007 The HUM in Britain a
Geographic Study leading to a New Causal Hypothesis of both UHF/Microwave
and low frequency magnetic involvement.
Batteau, D.W. (1968) Dwight Wayne Batteau’s
Work on the Significance of Energy Level Transitions in Nerve Function, Tufts
University, Medford, Massachusetts, Department of Mechanical Engineering.
Cherry N. 2000 Childhood cancer incidence in the vicinity of the
Sutro Tower, San Francisco Environmental
Management and Design Division P.O. Box 84 Lincoln University Canterbury, New
Zealand http://www.mindfully.org/Technology/Sutro-Tower-EMF-Cancer29may00.htm
Del Guidice et al (1989) Magnetic flux quantization and Josephson Behavior in Living Systems,Physica
Scripta 40 , 786-791
Deming
D.2004 the Hum: An Anomalous Sound
Heard Around the World Journal of
Scientific investigation Volume 18, Number 4 (Winter 2004)
Dolk 1 H Dolk; G Shaddick;
P Walls; C Grundy; B Thakrar;
I Kleinschmidt; P Elliott 1997
Cancer incidence near radio and television transmitters in Great Britain. I.
Sutton Coldfield transmitter.Am J Epidemiol.
1997 Jan;145(1):1-9
Dolk 2 All high power transmitters. (Dolk et al.,
American Journal of Epidemiology (1997): Volume 145, pp. 1–9 and 10–17.)
Evans, M.W.
2004 THE ELECTROMAGNETIC AHARONOV BOHM
EFFECT,
http://www.aias.us/Comments/Historical%20Comments/comments02182004.html
Lai , H. Paper for the Scientific Workshop “EMF-Scientific and legal Issues, Theory and Evidence of EMF Biological and Health Effects” in Catania, Sicily, Italy, September 13-14, 2002, organized by the Italian National Institute for Prevention and Work Safety. http://www.energyfields.org/science/lai091302.htm
Ho Mae-Wan (2005)
Non-Thermal Electromagnetic Fields & Cell Water Presented at Green
Network Conference, Science Medicine and the Law , 31 January-2 February 2005,
RIBA, London, UK
Massey, H and Fraser, P. Introduction to quantum biology, 2003, http://www.nutrienergetics.com/quantum_biology.html
Michelozzi,
P. et al, (2002), Adult and Childhood Leukemia near a High-Power Radio Station
in Rome, Italy, American Journal of Epidemiology 155 No.2, 1096-1103.
Pitkanen,
M.(2006) Homeopathy in Many-Sheeted Space- time, Department of Physical
Sciences, High Energy Physics Division, University of Helsinki,
Finland.
Sebastián, J.L.et al(2001) Analysis of the influence of the cell geometry, orientation and cell proximity effects on the electric field distribution from direct RF exposure Phys. Med. Biol. 46 213-225 doi:10.1088/0031-9155/46/1/315
Smith CW and Best S Electromagnetic Man: Health and Hazard in the Electrical Environment (Hardcover) Chapter 11 Palgrave Macmillan (Nov 1989)
Smith, C (2001) in Electromagnetic Hazard and Therapy http://www.em-hazard-therapy.com/
Smith, C.W. (2004) Quanta and Coherence effects in Water and Living Systems, I-C-M Journal August 2004 Edition.
Smith CW , (2006) Herbert Fröhlich FRS: A physicist ahead of his time” Fröhlich's Interpretation of Biology through Theoretical Physics G.J. Hyland & P. Rowlands (Eds.) The University of Liverpool, 2006. Chapter 7: pp. 91-138
Srinivasan, T.M. (1999) A Subtle Energy Technology for Noise Reduction in Physical and Psychophysical Systems Co-Founder International Society for the Study of Subtle Energies and Energy Medicine (ISSSEEM) http://homepages.ihug.co.nz/~sai/subtle.html
Wolf, R
and Wolf, D. (2004) Increased Incidence of
Cancer near a Cell-Phone Transmitter Station International Journal of Cancer
Prevention 1, NUMBER 2, APRIL 2004.
Paper No. 5. Taos type HUMS complex electro-acoustic phenomena with many manifestations, the crucial role of jet streams, storms and infrasound; are humans as radio acoustic atmospheric sounders and is electromagnetism cause or facilitator? By DR CHRIS BARNES
Bangor Scientific Consultants, ‘Llwyn Heulog’, Ffriddoedd Road, Bangor, Gwynedd, Wales, LL57 2TW
Abstract
A new model of the HUM involving Bragg matched infrasound with multiple electromagnetic frequencies is proposed. Some experimental evidence on effects of wind speed and direction and the crucial role of jet streams at a particular location which suffers the HUM are presented and discussed in terms of the model.
Introduction
The Taos HUM or more simply the HUM as it has become known World Wide is an elusive, yet to those afflicted, often highly disturbing and mainly nocturnal, auditory phenomenon perceived by an estimate of between 2-11% of the population in the Western World. The peak age for perceiving the HUM is around 50 years old and more women than men seem to be afflicted. Younger people sometimes perceive the HUM. The author’s twenty two year old son perceives it on occasions, but no as often as the author and his wife. The word ‘hum’ actually seems somewhat a bit of a misnomer for it implies a continuous noise, whereas in all but a few cases the HUM as actually perceived as a subliminal and intermittent on/off or amplitude varying buzz. HUM reports are actually increasing on a world wide basis with more and more countries reporting cases of the HUM. This is suggestive that the HUM is in some way associated with modern technology (also on the increase) or alternatively with some as yet unknown planetary changes.
Some say the HUM is due to the ringing of the very Earth itself but since this has a frequency of some 2-7 milli-hertz (New Scientist 29th September 2004) and will have been since time immemorial, it is difficult to reconcile.
Infrasound has recently been shown by the author to be involved in the HUM
( Barnes 2007) and been cited by others as a possible cause of the HUM (Leventhall 2003).Yet it is fairly easy to rule out anthropogenic infrasound as the sole cause of the HUM per se. Factories (http://www.advanced-noise-solutions.co.uk/noise-nuisance.html), drains (Zhou 2004), pipelines ( Corliss 1990) and Zasetski 2004), buildings and bridges (Donn et al 1974) all potential sources of anthropogenic infrasound have been around since the industrial revolution. Cars, roads and motorways, see Fox (1992) http://www.newscientist.com/article/mg13518321.000-factories-and-traffic-blamed-for-the-hum-.html), also a source of infrasound, pre-date the times when most major HUM reports began, that is the 1980’s in Britain and 1990’s in the USA. More recently wind farms are an important potential source of infrasound (Kelly et al 1982). Similarly, natural infrasound sources such as the jet stream, winds, waves and the earth itself have existed since time immemorial (http://serendip.brynmawr.edu/exchange/node/90). Unless then a whole swathe of the population has suddenly become more sensitive to infrasound, how could its involvement in the HUM be justified? Some have recently measured low frequency sound at frequencies in the range of 50-80 Hz and ascribed it to be associated with the HUM, see Moir (2006) and Moller (2005), in particular with respect to the sound amplifiers of Lennart Branthle. Moller (2005) presents an email from Branthle wherein he concludes the HUM is an acoustic signal yet some 20dB below the threshold of his hearing. The inference deduced by the present author is that such a possibility is real provided there exists another vehicle for simultaneously and/or synergistically guiding the HUM into the human body and initial work has been conducted to suggest this may be electromagnetic (Barnes 2007). The author does not feel it is appropriate simply to suggest that there is a sub-set of the human population with highly developed low frequency hearing because this would not account for the recent explosion in HUM cases, unless that is the size of that sub-set were in itself also increasing as a result of some as yet unknown sensitisation process. The HUM is often experienced as a pulsating signal, suggesting some kind of modulation or that it arises as beats between two other signals, one perhaps of constant frequency and one of slightly varying frequency, perhaps Doppler shifted for instance. If indeed Moir and Branthle’s HUM is one and the same thing perhaps HUM hunters should be looking for two higher or lower acoustic frequencies in the environment which beat or mix together to give HUM frequencies in the range 50 plus to 80 Hz.
As an alternative to infrasound, it has in the past been perhaps more persuasive for some to accept electromagnetic signals, in whatever guise, as the cause of the HUM, particularly since they are proliferating in our society at an alarming rate. Deming (2004) who postulated that the likely source of these signals was TCAMO type U.S. Naval transmissions in the region of 50 KHz, his basis for this being that some people can hear the aurora borealis which is known to emit electromagnetic waves of this frequency order. Leventhall (2003) mentions the possibility of even lower frequency Naval transmissions such as those arising on 76 Hz from project Sanguine and similar Russian transmitters. The difficulty with the logic in this argument is that we are bathed in electromagnetic radiation from the power grid and electricity house wiring at much higher field strengths and yet do not have a permanent 50 Hz buzz in our heads. Nevertheless, the present author ( unpublished work) has previously confirmed that bio effects similar to the HUM can take place at hitherto lower than expected high radio frequency field strengths in the presence of stronger than average lower frequency magnetic fields. Thus arguing that the HUM is a bio-effect such phenomena are in all probability also relevant to the HUM and it has suggested that this involves a subtle and complex behaviour involving multiple infrasonic and radio frequencies, some low and some high. Furthermore also given is an explanation in terms of complex electromagnetic theory as to why certain locations are more prone to HUM in terms of the transit time phase separation of magnetic vector B and magnetic potential A parameters and following the predictive theory developed it is been possible to predict exact geographic location wherein certain individuals will perceive the HUM (Barnes 2007).A further fact in strong support of electromagnetic involvement is that both the author and his wife only perceive the HUM in their right ears. The right ear is several hundred times more sensitive to electromagnetic waves than the left, recently proven by See et al (2007). Furthermore, there are several other reports on internet HUM forums from individuals who experience the same effect. Since infrasound is a relatively pervading sound field, it would seem that on a World- wide basis, there ought to be considerably more locations which fulfil such pre-requisites for the HUM than actually experience or report it. Considering actual geographic HUM patterns, not only are HUM reports sparser than expected but they are also often anecdotally associated with additional, unusual and hitherto unexplainable variables in determination of amplitude and appearance. Why for instance are there reports on internet HUM forums of increases in HUM amplitude or periodicity with the full moon or with particular weather patterns or jet stream configurations? Why does the HUM pulsation pattern as humanly perceived not fit any known modulation scheme if it purely electromagnetic? Why are there reports of high level aircraft disrupting the HUM? Why are there even some reports of the HUM getting louder in early morning sunlight! Why does Dawes (2006) conclude that the HUM is associated with the effect of the UK power grid on gravity! Why do some individuals feel as though their entire heads, teeth, jaws or even whole bodies are vibrating in some way when they perceive the HUM? This latter effect is known to be associated with fairly high level infrasound, yet infrasound, either anthropogenic or natural, is rarely measured in HUM locations at sufficient amplitudes for it to be the only or sole contributor in HUM perception.
So here we have the HUM; a seemingly impossible phenomenon to properly quantify, with what often appear like totally unrelated requirements and situations for its perception, and with both infrasound (Cowan 2003), (Leventhall 2003) and radio waves (Deming 2004)(Barnes (1+2) (2007)) separately cited as its causes. An original paper due to Joe Mullins and Jim Kelly dated 1995 which cannot readily be located elsewhere, but is found on Dawes’ (2006) website concludes that for the Taos Hum, its hearers are not extracting the HUM stochastically from background noise. Yet they also conclude that the only signals present, in terms of indication on their suite of measuring instruments, were acoustic and electromagnetic. So what if both types of these signals are mutual requirements for the HUM? What if multiple radio frequencies with appropriate phase relationships are merely the facilitator for carrying infrasound into the body more effectively? What if infrasound modulated the radio fields in some way or vice versa? In addition, what if electromagnetic fields do make the ear more sensitive to low frequency noise? The full truth is something really subtle simply has to be occurring. The present author believes Demming (2004) came so close when he mentioned the aurora. Here is nature’s electrophonic concert for the taking. For instance when people perceive its whispering, hissing sounds in their direct locality, their perception arises from more than just radio alone. In the case of a visual aurora, sight may obviously play a part as well as sound. The aurora is certainly known to be a source of infrasound (Maeda 1963) which has recently been audio recorded (Laine 2004). Indeed, any ionised or partially ionised gas or plasma can radiate sound. One only needs to listen to 100 Hz corona discharges near a high voltage power line to realise this (Straumann and Semler). Thus with perception of the effects of the aurora then it becomes easy to see how several of the human senses work in synergy.
As a present hypothesis for the HUM, the complete detail of electrophonic perception of the aurora is a good pointer. To re-iterate, the aurora is an electrophonic phenomenon where broad spectrum waves; light and sound and radio go hand in hand with slow Hz pulsations of the Earth’s magnetic field. If we can accept this, then perhaps we need to seek the same or similar variables in the HUM before we will fully understand how and why it is perceived by humans. We should perhaps then, expect the HUM to arise not from a single radio or audio frequency source, as some have postulated, but from a multiplicity, allowing for beats and an almost plethora of possible bio-interactions to be involved in its perception.
A general investigation of the HUM for its content, mutual sources of radio frequency and infrasound.
Barnes (1) (2007) has suggested that a factor possibly involved in HUM perception are atmospheric gravity waves (AGW’s). AGW’s may be associated with acoustic sound or infrasound (Naugolnykh and Rybank 2005) and are associated with perturbations in the atmospheric refractive index which can effect radio propagation (Tonning 1957). Barnes (1)(2007) also commented that the ear may be made up to ten times more sensitive to low frequency noise than normal during natural or electromagnetically induced tensor tympani syndrome. The possibility of electromagnetic interaction with an EA (electro acoustic) or LES (Longitudinal electro scalar type wave) in HUM perception cannot be ruled out. Until recently many physicists would question the existence of such waves, however, there is now experimental proof of there generation and measurement of their propagation in the atmosphere (Rapoport el al 2003), ( Khvorostenko 1992). In many respects the effects of an infrasonic wave and LES wave might prove indistinguishable. Dawes (2006) has commented on the exciting of 50 Hz vibrations in small pendulums containing non conducting materials as proof of gravity perturbation by the power grid, his sole cause of the HUM. However an airborne infrasonic field or an LES wave at 50 Hz would produce the same effect, see Saulson (1984). Similarly electrostatic induction from an LES wave could be the cause of Dawes’ so called ‘wall voltage’ (Dawes 2006). It is now undisputed that ion acoustic waves generated in the ionosphere can propagate sounds to earth in the range 1 -40 Hz, although the attenuation gets more severe as the frequency increases (Vaivads (2002) http://members.tripod.com/~auroralsounds/#dir). Similar to an LES wave are the pulsations experienced in the Earth’s’ electric field during fair weather and fog with a periodicity of up to 1Hz (Anisimov et al 2001). These may or may not be related to so called ‘slight atmospheric pressure oscillations’ which have a similar maximum oscillation frequency ( Delyukov and Didyk 2004) and are thought to be responsible for meteo-sensitivity in humans.
Anecdotal HUM issues used to confirm mutual infrasonic and electromagnetic involvement.
The author has run a short series of experiments, in an attempt to confirm the validity of some unusual cofactors often reported to be associated with the HUM. The issues covered are;
· HUM mainly experienced at night
· Full moon effects
· Cloud clearance effects
· Jet stream shape
· Early morning sun
· Effect of heavy lined curtains
· Effect of eyes open/closed on HUM perception
· HUM has been reported to stop for a time on passage of high level passenger planes even when their engine noise could barley be heard
Results and brief discussion of additional experiments
1. Night time HUM and Full moon effects
The author and his wife often perceive the HUM louder when there is a full moon or at least some moonlight. The night time boundary layer is known to be more stable on clear moonlit nights. Anthropogenic or natural infrasound and VHF/UHF radio waves arising from sources up to tens of kilometres distant will be propagated further if there is a stable inversion layer. Atmospheric scintillation will transmit better optically if there is moonlight (Hickeson and Lanzetta 2004). Tides which are diurnal are influenced by lunar gravity and generate infrasound in the form of microbaroms (Domm and Balachdran 1972) and (Rind and Domm 1975).
2. Cloud clearance
At the author’s residence, the HUM is sometimes perceived louder when a night time cloud layer is breaking up in the early morning. The author lives quite close to mountains. When a cloud layer is breaking the wind speed and shear will be changing. Any sound ( Kulichov 2003), Jones (2004), (Drob 2005) or radio waves might also propagate differently (Reddy and Reddy 1993). This is particularly so during turbulent episodes which can occur surprisingly close to the ground at night ( Dekker et al – VTMX Campaign October 2000).
3. Jet stream shape
The HUM is always perceived louder in Wales when there is a closely approaching Westerly Jet stream kinking just offshore and particularly to the North of Britain. Clear air turbulence (CAT) is associated with such conditions (Elrod and Knox 2005). CAT is also associated with atmospheric infrasound, see later. During periods when high pressure is dominant in Britain and the jet stream is more than 800 miles or so from the Western approaches, the HUM is almost always absent, apart from when there is deep low pressure nearby, indicating the crucial role of the jet stream or wind gradients in HUM formation and perception, both are also known to have a crucial role in infrasound generation and propagation (Jones et al ) http://cires.colorado.edu/~mjones/raytracing/poster.pdf Conversely the HUM recedes when the 300mb jet stream is more than 800km from the Welsh Coast.
4. Heavy lined curtains
Heavy lined curtains are said to sometimes reduce the HUM level when moonlight or early morning sunlight is present. Very surprising the HUM is sometimes perceived louder when looking towards or into the light and perceived less with the eyes closed. Thus the curtains make little difference in the case of closed eyes. This is an unusual effect but one which has been commented upon similarly in HUM forums. The eye is known to resonate at infrasonic frequencies. Air turbulence gives rise to optical scintillation which can be measured with a simple lunar scintillometer (Tokovinin 2006). The idea here is that if scintillation frequencies are somehow in phase with the HUM frequency or a component thereof, then the HUM will appear to be reinforced. Synaesthesia is a known medical condition wherein the senses are coupled. Maybe something similar is relevant in the sensitisation produced by the HUM.
5. High altitude jet aeroplanes
Although there are reports of this on Internet forums from the USA, the author only noticed a slight reduction of HUM level and on only one occasion associated with a plane. The effect was not dramatic as it is with ground level vehicular passage. A plane would disrupt the jet stream or infrasound or radio waves or both from high level sources but would not be so relevant to any such signals arriving from lower levels in the atmosphere. Even sub-sonic aeroplanes can also create coherent infrasound in their own right (Evers 2003) http://www.knmi.nl/~evers/infrasound/events/030818/030818-eng.html. This is suggestive that at least at the author’s residence most of the HUM is generated at lower levels than the jet stream or has already been propagated to lower atmospheric levels (see Rottger 2000) from the jet stream at distances further removed than those which the sound of plane can be heard. This might not be surprising given the higher attenuation coefficients of higher frequency sound in the atmosphere.
Mechanism of HUM perception, finding which factors compliment human experience of the HUM, Deep Radio Fading, Infrasound or both.
Based on peoples’ perception of the complex electro-acoustic phenomenon which is the aurora, the hypothesis is that similarly electromagnetic waves are a complimentary vehicle for the HUM which must also have an appropriate co-factor and sometimes even an optical co-factor. The most worthy candidate for this can only be regarded as valid if it satisfies and explains the type of anecdotal reports seen above and if it fits in with previous and present experimental observations at the main HUM sites world-wide. It is also naturally pre-requisite that new theory should align with the author’s previous findings on electromagnetic frequencies. In such a case if the HUM is conducted electromagnetically, why then do people not hear the electromagnetic signal modulations? If the body or various parts of its biological systems are responding coherently to the HUM then it is logical to expect there will be a certain coherence time involved to ‘phase lock’ the signal as it were. Radio modulations usually vary at millisecond rates whereas the author has previously shown that the HUM ‘dead-time’ after disturbance by a moving vehicle is of the order of 5 seconds. Perhaps therefore one might expect only a steady state or average evoked stimulus in response to a fast modulated radio carrier wave. However it may be possible to perceive slower pulse modulations or even actual modulation if there exists an alternative and suitable nearby non-linear passive demodulating element (Tektronix Application Note on Fundamentals of Interference in Mobile Networks)http://www.tek.com/Measurement/App_Notes/2G_14758/eng/2GW_14758_0.pdf There have been anecdotal reports of dissimilar metals in tooth fillings or rusty fences producing such effects ( Rozell 1995) http://www.gi.alaska.edu/ScienceForum/ASF12/1221.html
HUM frequencies world-wide have been matched by hearers at between 32 -76 Hz with modulating bursts or pulse repetition frequencies of between 1 and 5 Hz. Recently a low frequency acoustic noise of 56 Hz has been audio- recorded in certain New Zealand HUM locations (Moir 2006). The author has heard HUM of approximately power line frequencies and harmonics in various locations throughout England with modulating undulations estimated between .2 and 5 Hz. In his home location he actually discerns the main HUM frequency as considerably lower than 50Hz but the modulations appear to pulse at between 2 and 4 Hz with an open right ear canal and at about 10 Hz with a highly obstructed ear canal (sealed with plastic sheet). This change in pulse repletion frequency could be understood if the main infrasonic component of the HUM was in the region of 10 Hz and its harmonics (due to internal non-linearity of the ear were beating with a higher frequency (more easily prevented form entering the body when the ear canal was plugged) as to produce the lower frequency quasi -periodic beats of the HUM. The quasi periodicity of the HUM could be produced in another way, it should not be forgotten however that under some circumstances radio channels can fade deeply in amplitude at similar frequency rates to the above (Reddy and Reddy 1993). As these signals gate infrasound into the body or at least sensitise the ear, it may be possible for the body to discern such deep slow fades in the signal strength of a radio channel if it is similar in length or longer than the bio-coherence time. Indeed such fades have been recorded in relevant UHF and microwave radio channels at the author’s home. Importantly in support of this hypothesis, the local Bangor HUM is extremely well perceived near the sea.
The sea near Bangor is the Menai Strait which is overlooked by several powerful radio, TV, GSM and TETRA transmitters. Recently it has been established that an interaction of radio waves and an electrolytic conducting medium is possible (Lyakhov and Suyazov 1998), so sea waves can generate infrasound directly in addition to the usual microbarom sounds from the sea. Of course sea waves can also directly scatter radio waves (Barrick 1972) and (Valenzuela 1977). This is a manifestation of the phenomenon known as transition radiation (Pavlov 1985). Sound and radio waves of comparable wavelength are scattered similarly from a sea surface until a certain wind speed is reached when they no longer see the same scattering centres ( Nutzell et al 1993). Sea wave frequencies can be effectively modulated onto VHF radio waves if the swell is gentle and the surface regarded as weakly corrugated (Bass et al 1988).
It is often said that humans cannot hear or perceive infrasound. Strictly speaking this statement is flawed. Humans can hear infrasound, but only at threshold levels of about 92dB, by which time the infrasound is not only perceived but very probably also producing injurious effect, dependent on its precise frequency and phase characteristic. It is well known humans are very poor at frequency matching any direct infrasound they hear or perceive (refs). Perhaps this is also true when infrasound is more sensitively gated into the body electromagnetically. Perhaps this accounts for the wide range of frequencies matched in HUMS perceived world-wide. Alternatively, perhaps most HUMS, world –wide, do exhibit subtle or even significant differences, but yet most humans simply discern in them a simple idling engine type pattern.
In addition to peoples’ experience of the aurora and this present hypothesis on the HUM , the notion of dual infrasonic and electromagnetic involvement in the HUM is perhaps not as far fetched as it may, at first sight, appear. Recently 17 Hz infrasound has been used to promote feelings of fear (Cowan 2003) and anxiety in modern music concerts (Radford 2003). Infrasound in the 17-20 Hz range and high levels of electromagnetic field has also been associated with haunting (http://www.spacedog.biz/infrasonic.htm) and the paranormal (Liddle 2003), see also Townsend (2005). For HUM perception then the premise is that all that is required then are suitable sources of infrasound and radio frequencies are present in HUM locations with suitable relative positions, amplitudes and/or phase relationships. Optical effects can be similarly related. For example the presence of such an infrasonic source in association with atmospheric scintillation would explain full moon and early morning solar effects and recalling for instance the human eye ball is resonant at infrasonic frequencies. Feeling that the whole body is vibrating or tingling might come about because the human chest cavity is resonant between about 40 and 80 Hz depending on frame, size and build. Reconciling all of the above might seem a tall order; however, investigation of the sites concerned yields plausible answers.
It is known that the HUM often manifests a pulsating noise. There are four possibilities to arrive at this. Either the phenomenon arises as a result of frequency dependent variable latencies inside the ear or brain of the hearer, or one could have a pulsating infrasound source, or alternatively, on could have a constant frequency infrasound source and a pulsating electromagnetic source and/or the relative amplitudes of either source could of course also vary independently due to fading along their propagation paths. Such is often a characteristic of multi-path radio propagation. Sound amplitudes are known to fluctuate in a particularly peculiar manner if the sound source is located very close to ground level (Bocharev 2005) and Waxler (2005). In the UK there are anthropogenic sources which potentially meet this requirement such as gas pipelines (Slaton and Zeegers 2005) and water mains and electricity sub-stations (Keerthipala et al 1998) and (Medeiros 2001). The final and physically most appealing way of causing a pulsating HUM is to consider direct wave to wave interactions (Hoffman). Provided that the wavelength of the infrasound (or LES wave) is comparable with the wavelength of the electromagnetic wave(s) involved then wave scattering will take place. If phase relationships are appropriate then Bragg scattering will result. This is employed extensively in the meteorological profiling technique known as radio acoustic sounding or simply RASS (see AMS glossary).
Bragg matching
In simple RASS systems both the acoustic signal and the microwave signal is fired into the atmosphere with at or near vertical incidence. A consideration of some of the relevant frequencies and wavelengths required for Bragg scattering rather as it used in Radio Acoustic Atmospheric Sounding Systems http://amsglossary.allenpress.com/glossary/search?id=radio-acoustic-sounding-system is very instructive. Under these conditions a radio wave of given wavelength is Bragg matched by an acoustic wave of half that wavelength. Such conditions might be likely in the case of the HUM if both an acoustic signal and a radio signal were arriving at the observer from near vertical incidence, say for example with the ionosphere.
A development of RASS is the bi-static CW system (Saebo, Triad AS) where only the acoustic beam is fired straight up and the microwave beam is fired obliquely at a fairly shallow angle. This creates a different shaped interaction volume and changes the conditions for Bragg scattering so that in essence acoustic waves with frequencies of some eleven times lower than with standard RASS can take part. Considering many
anthropogenic and even some natural infrasound sources to be at or near ground level and considering radio waves to propagate upwards into either the ionosphere or troposphere ducts (depending on their frequency) and more particularly at night, it is not unreasonable to suppose that a similar possibility for bi-static Bragg matching of sound and electromagnetic waves exists in the natural and built environment, hence able to give rise to the HUM. Radio waves propagating downwards from TV or mobile phone antenna masts may create a similar scattering volume with acoustic signals closer to the ground, thus allowing the HUM to be perceived on the ground floor of houses or in cars.
Considering the range of Bragg matched acoustic frequencies for given radio frequencies present in the environment is particularly informative. For instance a 100 KHz radio wave e.g. LORAN is Bragg matched by acoustic waves in the infrasonic frequency range 0.018- .2 Hz e.g. typical of microbarom or sea wave type infrasound. Interestingly, LORAN, has in some quarters, been blamed for causing the HUM. With infrasound from the sea as a Bragg matched partner for LORAN, it now becomes possible to hypothesise as to how this could be at least one recorded cause (Guardian, October 18th 2001). A 500 KHz radio wave (Medium Wave) would similarly require an infrasonic sound wave in the range .09- 1 Hz, also encompassing microbarom frequencies. A VHF FM radio wave of frequency 100 MHz is Bragg matched by 18- 200 Hz infrasound. A 400 MHz TETRA signal is Bragg matched by audio frequencies in the range 64-800 Hz. The UHF television Broadcasting Band is Bragg matched by audio frequencies in the range 80-1600 Hz. A 900 MHz GSM signal would require an audio signal of 163 Hz- 1.8 KHz. Similarly this would raise to 326 Hz- 3.6 KHz for 1800 MHz GSM and 380- 4.2 KHz for modern 2100MHz CDMA systems. It has been assumed that sound is travelling only in air at 340m/s for these calculations. Seismic sound travels considerably faster and will therefore Bragg match radio frequencies correspondingly some twenty times lower.
Ocean waves are a ubiquitous source of infrasound (Hagstrum 2001), Arendt and Fritts (2000). Power line frequencies and their harmonics both from high voltage transmission lines and electricity sub-stations are another ubiquitous source of infrasound and acoustic sound (Medeiros 2001). Barnes (2) 2007 has confirmed that for sites which maximise perception of the HUM there is a critical phase dependence between the magnetic A potential and the magnetic field vector B. Modulation of this phase difference by atmospheric Bragg reflection or multi-path mountain http://en.wikipedia.org/wiki/Multipath or foliage reflection (Randle 1999) could be the very origin of the HUM itself. Such radio wave foliage interaction is perhaps a likely consequence of fluctuating mean velocity and temperature fields giving rise to nocturnal wave-like air motion over canopies and tree tops (Hu et al 2002). In other words we have the possibility of ‘talking trees’ and humans acting like bio-radio acoustic atmospheric sounders! Take away any element in this complex equation and the HUM either goes away or changes its subtle characteristic!
An experimental study of a specific case of aggressive night-time HUM at OS Map location SH 572720 Bangor, Wales; made using wind speed and direction to assess likely infrasonic sources and radio frequencies.
Bangor is of course very near to tidal straits and river estuaries. The nearest wind farms to Bangor are onshore at Amlwch and Llyn Alaw and five miles offshore at Rhyl. Bangor is close to several other infrasound sources; including anthropogenic sources and natural sources. The anthropogenic sources include the bridges at grid references SH 556715 and SH 542710 and the electricity pumped storage turbine and header lake at SH 626620. Also more locally are low voltage electricity sub-stations and gas pressure reduction stations. It is possible sound could propagate from these under appropriate night- time boundary layer conditions. Bangor is very close to the 10KW 882 KHz radio Wales transmitter and the 250KW UHF TV transmitter at Llandonna. Llandonna also transmits 21KW VHF FM, 1KW DAB and 1 KW DVB.
The DEFRA report (Leventhal 2003) draws no distinction between aggressive and non –aggressive hums. Instead all HUMS are simply lumped together as a single phenomenon, variation in which way they are perceived being put down to human the One must then consider humans rather as radio acoustic atmospheric sounders. When an aggressive HUM is present it may be that it arises because of other frequency components beating with the general non –aggressive ‘background’ HUM. For example, it is possible through passive demodulation that for instance the 217 Hz modulation from a GSM base station might mix with the fourth harmonic of the mains frequency to produce 17 Hz also a component of TETRA! Then we would see a slowly beating aggressive HUM. Interestingly, the only other location in the UK wherein the author has experienced a similar aggressive HUM to the one in Bangor was at Ingatestone in Essex. This semi –rural location, similar to the author’s home location in a bench shaped corrie, on a gentle sloping hillside and was visited since the initial geographic study (Barnes (1) 2007). Close by are 900 MHz and 1800 MHz GSM transmitters but also 400 MHz TETRA. Albeit only by the experience of two locations, TETRA, it would seem, certainly has a potential to accentuate the aggressive HUM. Bragg considerations are interesting here. TETRA can Bragg match sound frequencies of over 64 Hz and since it contains its own amplitude fluctuation at a frequency of 70 Hz, it is a prime candidate for self Bragg matching given appropriate passive demodulation. Similarly any nearby electricity substations can generate audio frequencies of 100 Hz and one third and two thirds sub-multiples, 66.6 Hz being a distinct possibility. Once again given many beats then, the potential then for an aggressive electro-acoustic interaction is quite real. More and more communications towers are using co-sited antennas on all sorts of frequencies and with all kinds of modulation schemes. With this ‘progress’ comes the possibility of generating increased antenna borne passive inter-modulation products (PIMPS) (Steve Thomas; Anritsu Corp.) creating more and more cases of electromagnetic clutter and perhaps aggressive HUMS. Nevertheless people experienced HUMS in Britain way before the inception of TETRA. Such HUMS are most likely associated with UHF television signals and appropriately Bragg matched infrasound, not forgetting power line harmonics and sub-harmonics and noise from gas mains.
The author’s home in Bangor, grid reference SH 573719, certainly fits with all previous criteria for electromagnetic involvement and would now seem to fit the criteria for involvement of natural infrasound as well. The author’s home is quite elevated yet on a shallow bench –like corrie in a coastal location two kilometres to the south of open sea and two kilometres to the east of a narrow ocean strait and is some ten kilometres west from mountainous ranges and in an area of Britain which has prevailing West or South Westerly winds. The author (Barnes (1) and (2) (2007)) has previously shown that not all locations in the Bangor area experience the HUM. The inference then is that the HUM cannot be purely of infrasonic origin, because infrasound is known to be very pervasive, so under that premise alone, many more locations should perceive the HUM. Further this is countered by the already known requirement that to perceive the HUM; certain precise electromagnetic conditions have also to be fulfilled. In this previous work, the author has made an observation that the HUM seems to reduce with increasing wind speed; this could be associated with moving tress and objects reducing the temporal and spatial coherence of the required UHF and microwaves.
Besides living close to sources of natural infrasound, to re-iterate these are; the sea, mountains and a waterfall, the author also lives close to potential sources of anthropogenic infrasound. These are; a railway tunnel 400 metres to the South East, the Menai suspension bridge 1.6 km to the West, the Britannia Bridge being a combined road and rail bridge 4.25 km to the West and three wind farms, two onshore at Llyn Alaw and Amlwch about 20km to the North West and the third offshore about 30 km at North Hoyle to the North East and a pumped storage header lake some 10 km to the South East. These are all potential sources of infrasound in the region of 10Hz. There are also three nearby low voltage electricity sub-stations, located at OS grid references SH572718, SH 572720 and SH573721, and also a Super grid switch station 5km to the South East. The Super grid conductors run just below the mountain ridge to the North East. These are potential sources of 50 and 100 Hz sound fields and sound fields including one third and two thirds of these frequencies due to sub-harmonic generation as a result of the three phase nature of electricity supply. Finally it should be noted that there is a large gymnasium some 130 metres to the South –South-West of the author’s residence which is constructed with corrugated steel sides and roof. Not only could such a building act as a radio and/or acoustic reflector it could also act as a reverberant source. If this source were reverberant, this would further complicate the picture with regard to electromagnetic scattering (Lawrence and Sarabandi 2006). It is interesting to note that in most of the other local locations wherein the author has experienced loud aggressive HUMS there have been painted and or /corroded metallic structures including beach car park barrier, iron fences, power pylons and a rusty metallic barn. It is possible that some kind of passive demodulation at these structures, in addition to possible reverberation, could contribute to the perceived effects by providing in-phase audio components to stimulate the nervous system additionally.
In order to attempt to elucidate the combined acoustic (infrasonic) and electromagnetic involvement in the HUM at his home location, the author has made a more comprehensive study of the effect of both ground level wind speed and direction on the HUM and has also examined the effects of the Jet Stream. The wind speed values in knots were recorded as were their directions. A perceived subjective HUM level was recorded on a scale of 0-10; 0 being no HUM and 10 being an intolerable HUM requiring the full range of infrasound and electromagnetic ear defence. Several months’s worth of data were recorded and analysed. Not only can winds in association with the sea, atmospheric boundary layers and mountains generate infrasound but they can change the propagation of or mask ground level anthropogenic sources (Woodward et al 27th Seismic Research Review).
RESULTS
Initially the results for ground level winds seemed to reveal that wind speed as a function of perceived HUM intensity has a simple inverse correlation may be justified. However, with more data samples now available and these having been gathered from a greater range of wind speeds and wind directions a complex pattern emerges. Wind blowing through appropriately sized structures, natural or anthropogenic, can generate all kinds of acoustic as well as infrasonic noises. The wind can be used to make beautiful music viz a viz the Aeolian harp. Low level winds blowing from different directions at the author’s residence actually all have different effects on the HUM intensity. If the wind were simply reducing some electromagnetic coherence by randomly moving vegetation or metallic structures, one would have perhaps thought it might have been equally effective in all directions. However, if some wind induced or wind carried sound source or sources were involved with the HUM and if the HUM hearers were located outside the immediate near fields of those sources then a pronounced wind directivity effect as observed would be expected. Indeed this is exactly as is observed. When the wind data from different directions are plotted as sinusoidal fits, see figures 1-5, it would appear that there are some wind speeds at which the HUM is suppressed and some wind speeds at which the HUM is enhanced, indicative perhaps of multiple processes and phase critical interactions. Reflections and standing waves associated with the structure of the nearby sports hall are considered to be a possible cause for some of these interactions.
Yet another possibility here is that vegetation, particular nearby trees, responding to winds, do move as to reduce radio signal coherence, as previously suggested, but in doing so are responding as damped oscillators, only able to respond to certain wind speeds (Mayer 1989) and hence only able to reduce the coherence of the background radio fields at certain specific wind exposure times. Alternatively and perhaps more likely wind is destroying the coherence of arriving infrasound. It is certainly known to destroy the coherence of seismic infrasound; Withers et al (1996) have shown that winds with speeds as low 3m/s can, in certain circumstances, destroy the coherence of seismic infrasound at 15Hz and below whereas winds of greater than 8m/s were required to reduce the coherence of infrasound in the 23-55Hz frequency band.
The wind direction wherein the HUM is most wind speed independent is North West, see figure 1. This could either be because the author’s house is located on the leeward side of a slight north west facing slope, reducing the wind’s effectiveness or perhaps because the North West wind actually contains one or because more components of the HUM are generated in or propagated from that direction. In this latter respect it is interesting to note that the nearest wind farms are located some 20 km to the North West. Also the narrow sea strait, Menai Strait is located broadly in this general direction with its two bridges as possible infrasonic sources and further along which points have been located which have given rise to daytime HUM. It is possible that the infrasound from those points gets propagated further at night. In all cases, figure 1-5 the HUM intensity is greatest at low or zero wind speed indicating the propagation of a sound source in an undisturbed night-time boundary layer as a distinct possibility. Alternatively a very locally generated sound source is a possibility but this does not fit with the observations of the HUM at greater distances within the author’s locality, unless many such sources, the same or similar, existed and were fairly uniformly spread throughout the environment. In this respect it is interesting to note that there are electricity sub-stations and a high pressure gas main in the immediate vicinity. Such sound sources are of course relatively common throughout the urban environment.
These type of data are also reminiscent of the effects obtained using radio acoustic atmospheric sounding system (RASS) particularly of the bistatic type ( Saebbo, Triad AS, Norway) with the wind blowing either across or in line with the signal field. In that case Doppler shift of the radio frequency source is measured. It is rather as though humans perceiving the HUM are acting like bio-RASS systems!
Involvement of a large metallic sports hall located 130m to the South South West of the author’s residence is possible. When motor vehicles transit travelling North Eastwards i.e. approaching from the South West along the road which runs almost parallel with this hall and towards the author’s residence on the left, the HUM ceases for several seconds. Two metres to the south and travelling in a South Westerly direction there is no difference. Therefore it is suspected then there may be a standing wave radio and/or acoustic field in this area, possibly in the form of a pyramidal volume of triangular cross-section. Such a volume could accommodate both the high and low frequencies requited for the HUM. It is interesting to note that a South West wind, figure 3, of approximately the same velocity as a moving car also kills the HUM. It is believed this must be disturbing the sound field in the standing wave volume. It is not practical to apply Doppler equations for stationary or semi-stationary fields but at these wind speeds the Doppler shift would be significant on an audio signal but is not relevant to a radio frequency signal. The maximum East wind experienced to date is about 11 knots and also looks as though it is sufficient to shift the interaction from perhaps an anti-node to a node, figure 5. The results for the other winds appear to take on a sinusoidal form with a generally increased frequency perhaps because they blow less obliquely over the zone of interaction. From the results it is very clear to see that something analogous to Bragg scattering may be happening. This is perhaps why the HUM is perceived as more intensive on certain nights. The results figures 1 and 2 for North West and West winds are very instructive. The data have been plotted in the general form of sinusoidal fits according to the equation
Y = A + Bcos ( Cx+ D) ……………………………………………………..(1)
Table 1 below shows the coefficients of equation (1) for various wind –directions.
TABLE 1
|
|
A |
B |
C |
D |
|
Wind direction |
|
|
|
|
|
|
|
|
|
|
|
NW |
5.85 |
2.65 |
1.11 |
-0.736 |
|
W |
5.79 |
3.37 |
0.38 |
-0.636 |
|
SW |
0.87 |
9.33 |
0.04 |
-0.231 |
|
S |
4.19 |
6.04 |
0.138 |
0.214 |
|
E |
6.74 |
5.94 |
0.19 |
0.83 |
Parameter ‘A’ represents the non- oscillatory constant which appears largest for a wind from an Easterly direction and smallest for a South Westerly Wind. There are mountains, power lines and waterfall to the East and a TETRA mast and a pumped storage lake to the South East. The oscillatory constant ‘B’ is largest for the South West wind confirming suspicions that there will be a scattering zone associated with the Sports Hall. An alternative explanation is that the South West wind by blowing towards the North East is destroying the coherence of an oscillatory field in that direction. If one makes the assumption that a GSM signal from the nearest Macrocell will be reflected towards the author’s house in the region of the sports hall then Southerly and Easterly winds will be blowing almost normally across the reflection track whereas North Westerly and Westerly winds will be blowing along track and South Westerly winds will blow obliquely across track. An alternative UHF signal which could be similarly reflected is the local TV transmission. One has to make the assumption that the other requisite sound and radio fields will also be somewhere in the scattering volume. The problem is far too complex to solve analytically, but reference to the angular components C and D are instructive. D is positive for cross track winds and negative for along-track winds. Clearly the standing wave field oscillates more wildly when the winds are on track with the reflection zone. A south westerly wind seems to produce a longer oscillatory period presumably because it is blowing across not only the incident and reflected path but also takes time to propagate in between. It is interesting to note that the space in between these zones as defined by the length of the sports hall and distance to the author’s residence is about 300 metres about the wavelength of a medium wave radio transmission or a 1 Hz sound wave or a 23 Hz underground seismic wave. A moving vehicle entering this zone would take five or ten seconds to transit and would disturb the fields involved with these components of the HUM accordingly. Similarly all the winds will also agitate nearby foliage to a certain extent which is a mechanism to attenuate and reduce the coherence of UHF radio and microwave signals.
Returning to findings of Withers et al (1996) puts a very interesting slant on the data particularly if one assumes that all the sound fields arriving in the scattering zone are quite directional and could have their coherence ‘blown out’ by opposing winds in a manner broadly according to Withers’ findings, which have here been extrapolated across a wider range of frequency and wind speed. The relevant information after extrapolation of the wind speed from each sinusoidal plot for the first HUM ‘node’ is shown in Table 2 below;
TABLE 2
|
WIND |
ACOUSTIC |
BRAGG MATCHED |
STRONGEST POSSIBLE |
|
DIRECTION |
FREQUENCY HZ |
R.F. RANGE MHZ |
R.F. SOURCE |
|
|
|
|
|
|
NW |
5-9 HZ |
2.5-49.5 |
SHORT WAVE |
|
W |
24-31 HZ |
12.2 -135-171 |
VHF PAGING |
|
SW |
99.5 -155 HZ |
50.59-870 |
FM ,TETRA,TV |
|
S |
52-78 HZ |
26-56 - 293-435 |
FM ,TETRA |
|
E |
20-30 HZ |
9.9-15.9 - 110-165 |
FM, VHF PAGING |
|
NE |
29-38 HZ |
14.4-160-210 |
PAGING, DAB |
Table 2 clearly shows most of the acoustic frequencies could be accounted for by stating that they are within the range of power line and sub-station frequencies, harmonics, and their sub-harmonics. Particularly of interest is the result for South West winds. There are electricity sub-stations to the North, the North East and South West of the author’s residence and this result shows the highest oscillatory constant (table1). It is well known that power transformers generate a fluctuating periodic component at double the power frequency fundamental with varying load (Keerthipala et al 1998), this frequency is seen in the range for SW winds (Table 2). Despite so much electronic technology in Japan, as far as the author is aware, there are no reports of the HUM in that country. Japan uses mainly underground and indoor electricity sub-stations with gas insulated transformers (Tsukao and Hasegawa 2002), presumably this minimises their experience of the HUM. It is also very interesting to note that Japan appears to take the problem of infrasound in general far more seriously than in the West(http://www.acoustics.org.tw/asoroc/report/Dr.%20Yamashita's%20Paper.pdf). So perhaps in this light there are simply fewer sources of infrasound available in Japan to produce acoustic beats and Bragg match with electromagnetic waves. Of course in line with the rest of the developed World, Japan has an explosion of the latter.
In Bangor, radio frequencies capable of Bragg matching audio in the range 20-160 Hz are all available locally. Assuming the South West wind blows out sound from the North East, the most likely candidates for Bragg Matching are the local VHF FM and UHF TV signals from Llandonna located to the North Norht East of the author’s residence. Assuming the North Easterly wind blows out sound from the West, the most likely candidate for Bragg Matching this sound is the nearby BT Paging Transmitter operating around 150 MHz. The sound frequency associate with the South West is 29-38 Hz. The Britannia Road and rail bridge lies broadly to the South West and a calculation based on scaling from the Tappan Zee Bridge (Donn et al 1974) yields an expected infrasound emission frequency of 22.3 Hz for this Bridge, a quite close agreement. Similarly if the Easterly wind blows out the coherence of sound from the West, where the Menai Bridge is located, its predicted frequency based on its span is 17.8 Hz. The range of frequencies associated with this wind is 20-30 Hz again in remarkably good agreement. At first site there is less certainty concerning the sound source to the East. Based on features on the map, one could assume Mountain or Waterfall Infrasound is the cause of the frequency from the East which is blown out by Westerly winds and is in the range 24-31 Hz. A study of the effects of the jet stream (see later) sheds more light on this issue. Alternatively centrifugal compressors in the gas industry can also produce noise in this frequency band. There is a Gas Pressure reduction station just to the East of the author’s residence. It should not be forgotten two wavelengths might be involved here because sound form the gas grid can travel through the air and underground into the walls of buildings.
The South Wind would appear to be associated with TETRA frequencies. Given the position of the TETRA mast, the wind would seem here to be acting cross-track rather than along track, suggestive perhaps that the TETRA signal is being passively demodulated to produce its own self contained acoustic field. Alternatively and additionally this direction would appear to be associated with the acoustic frequency band of fifty plus to eighty Hertz as described by Moir (2006) and Moller (2005) as being highly implicated in the HUM.
The only acoustic frequency difficult to account for is the one associated with the North West wind, namely 5-9 Hz. It could be that this is associated with mountain infrasound radiating from the mountains in the South East or from the turbines at the Dinorwig power station, alternatively it associated with a more local sound source, possibly also associated with the high pressure gas main. Certainly frequencies in the range around 11Hz have been associated with gas supply (Springerlink.com / index / Q6JH11813263UP67.PDF). Consideration of the Bragg matching radio frequency range is appropriate here. This is predicted to be between 2.5-4.5 MHz at the lowest and up to 49.5 MHz at the highest. It is interesting to note that the extremely powerful ionosphere heaters often transmit in the lower part of this frequency range at night. There are no strong local sources of short waves and low VHF frequencies which leaves only the lower frequencies in this range as possibilities. At night these are returned to earth from the ionosphere. Mountain waves are also known to propagate to the ionosphere. Similarly the whole UK gas grid could be a formidable source of infrasound (New Scientist 30th May 1992). There is no reason to suppose that with the frequencies and lengths of pipes involved this infrasound should not be capable of radiating upwards for large distances, possibly to the ionosphere (Mutschlecner and Whittaker 1990).
To investigate associated variation in radio field strengths, a radio scanning receiver was set up at the author’s residence to elucidate variation in strengths of signals on windy and non windy days. The local 400 MHz TETRA signal varied in received signal amplitude by less than 10%. One local GSM signal hardly varied in strength at all while another one only 2 MHz away in frequency varied with deep fades up to 70% of amplitude. The local UHF TV channels transmitted from the North North East across the Menai Straits varied by very deep fades up to 90% of amplitude. The frequency of all the fades increased dramatically when it was windy or when vehicles passed by. It therefore looks as though UHF TV transmissions are also getting trapped in the scattering zone. From this result it seems that although TETRA was previously shown to be relevant in the HUM, it may simply increase the potential for the HUM, possibly because its signal pulses at 17 Hz an infrasonic rate. For instance North Shore New Zealand has reported the HUM but has no TETRA (Moir 2007). The electromagnetic signals being scattered the most appear to be GSM and UHF TV. Such effects have been noticed elsewhere for TV signals (Das et al 1989) and (Sim and Warrington 2006).
An additional experiment was conducted at a number of local sites one evening when a strong Southerly wind was completely extinguishing the HUM at the author’s residence. A very weak HUM could be discerned sitting in a parked vehicle at grid reference SH 584707, despite quite a significant wind. The only point where the HUM was strong was a point much lower in town sheltered completely from the wind, grid reference SH 584725. The conclusion is that when the wind is local to the HUM hearer, it will generally, by whatever mechanism, disrupt the HUM. This supports the notion that at least part of the HUM acoustic field may not be immediately local.
To test this, a second additional experiment was carried out on a still night in a parked vehicle at location grid reference SH 589718 which is located such that the magnetic A and B components of the local TETRA transmitter will be exactly pi/2 out of phase.
To the North East of the location was a gas pressure reducing station and to the South East a low voltage sub-station. The HUM was perceived as very loud and aggressive. This location is on urban estate but there was very little vehicular movement at that time. A vehicle passing the road junction at map reference SH 590718 had the effect of deadening the HUM for some 5 seconds or so. The vehicle was travelling from North to South at approximately 40km/hr. The vehicle was to the East of the fixed HUM monitoring location. The TETRA mast was due south of both. The inference seems to be that the vehicle may have been disrupting a sound field was originating from the East, or the Tetra field from the South or both. This is similar to the conclusion reached for the non –oscillatory component of the HUM above. Possible sound sources broadly to the East of both locations are the power grid, the mountains, the waterfall, the Pumped Storage Lake and separate electricity sub-stations and gas pressure reduction stations. Sound could of course be reflecting off the mountains or being propagated for a significant distance in the night –time boundary layer from elsewhere. A crucial feature of the HUM seems to be that it is more easily disrupted by vehicular movement than by wind. Being metallic a vehicle will readily disrupt both a sound field and the electric component of an electromagnetic field, whereas the wind will have largest effect on a sound field. Under the present hypothesis, both types of field are needed for perception of the HUM. This may account for why in many rural and quiet urban areas of the world the HUM appears to ‘switch on’ late at night when vehicular movement dies down. Similarly although the night-time boundary layer starts forming after dusk it will take time to stabilise after which optimal sound transfer from a distance will occur. Daytime HUMS can probably be heard closer to the sea because the sea temperature varies less than that of the land so there is more of a stable boundary layer present for mire of the time and less diurnal variation.
Effect of the Jet Stream
The results for Jet stream winds generally reinforce the results for ground level winds. Several significant Welsh mountains are located broadly to the East of the author’s residence. Jet Streams from directions which don’t impinge on the mountains or impinge on the windward side (same side as the author’s residence) have the effect of slightly reducing the HUM. Unless that is they are seriously kinked in shape just to the West of Britain, a sign of shear and turbulence ( Smigeilski 1960 and Colson 1960), which can be its own source of infrasound. On the other hand when the author’s residence is to the lee of the Jet Stream with respect to the mountain ranges, i.e. for Jet streams approaching from broadly Easterly directions there is a slight increase in the subjective HUM level, figure 6. This is probably due to mountain infrasound generation by leeward scattering. Leeward generated winds scattered to lower levels could also however assist in the propagation of sound from any other source, simply by blowing it in the wind as it were. Possible sounds to arrive in this manner other than mountain infrasound itself could be from the power lines, the waterfall and the pumped storage lake at Dinrowig and associated turbine. In no case are the correlation coefficients high. Shearing between low and high level winds at atmospheric boundary layers is known to produce infrasound and air turbulences Smigeilski 1960 and Colson 1960).
In support of this, a positive linear correlation, figure 7, has been found between the subjective HUM intensity and intersection angles of low level winds and jet stream winds at the author’s residence but once again the correlation is poor, with a regression coefficient of only 0.31. This adds some credence to the observations of HUMS in regions with CAT not near the coast. No such regions exist in the UK sufficiently far from the coast to fully test this hypothesis. It also tends to confirm the notion that atmospheric turbulence and associated mountain infrasound has at least some, if relatively minor, part to play in the HUM at the author’s residence.
ABOVE: Figure 6 Effect of East to West flowing Jet Stream weak positive correlation with perceived HUM level.
ABOVE: Figure 7, Effect of angle between upper Jet Stream and low level wind on relative HUM intensity.
None of the Jet Stream data, from Jet stream winds in any or all directions, fitted sinusoidal equations as did the data from the plots of HUM intensity versus ground level wind speed and direction. The conclusion is that there is no Bragg Scattering taking place at Jet stream height and simply that any infrasound or turbulent effects from this height propagate to other levels on either side where significant effect and interaction with electromagnetic waves takes place. There are few occasions when the UK is not proximal to a jet stream. However the author has noticed that when the jet stream is more than about 800 miles distant from the UK, the HUM in Bangor completely ceases with the exception of just 2 days in a 3 year observation period on which deep low pressure was in the south western approaches of the UK but no significant upper level jet stream was marked on the 300mb CRWS Jet Stream map http://squall.sfsu.edu/crws/jetstream.html. The jet stream is a source of infrasound in its own right but in the present context is the most likely driving source for mountain infrasound. Also it is known that other sounds can propagate into or through the jet stream (Chung et al 1970).
Overall, the results presented here are supportive of the original hypothesis and suggestive that HUM generation is very complex problem involving more than one infrasonic co-source in addition to the stated requirement for more than one electromagnetic source for enhanced perception, small wonder that no single person has completely ever elucidated the mystery of the HUM.
Discussion
The results obtained by this study are equally supportive of two possible and quite radical ideas. The first of these is that the wind at appropriate speeds in coastal mountain areas and at night can generate infrasound by interaction with mountains and atmospheric boundary and inversion layers. When infrasound of the correct frequency is produced it will scatter radio waves also of appropriate frequencies. Because the infrasound or radio frequency field in itself may also be pulsating, the Bragg type interaction which occur are manifests is perceived as the aggressive HUM. The idea being that the body can adjust to living in a radio field(s) or an infrasound field but not both, particularly if their wavelengths are comparable. Previous work, Barnes 1 and 2 (2007), has shown the magnetic components of the radio field to be most relevant. A useful analogy is to think of someone sitting in a chair. You get used to the mutual pressure and blank it out; however, if a spring bursts in the chair and stabs you in the posterior then you are instantly aware of this! The second equally valid hypothesis is that together with a natural infrasound presence, anthropogenic sources of infrasound are also additionally relevant, as they can be propagated through night time boundary (inversion) layers and so scattered and diffracted in mountainous regions such that they too are involved in Bragg interactions with radio waves of appropriate frequency and similarly perceived as the HUM. In other words the magnetic components of electromagnetic fields are merely the vehicles for conducting the infrasound mediated HUM into the body which to be perceived needs a very precise set of interacting and intersecting variables; these being namely the following; a source or sources of radio emission and infrasound of comparable wavelength(s). Amongst others, ubiquitous 50Hz vibrations, harmonics and sub-harmonics from the power grid and electricity sub-stations are a possible source for infrasound. The prerequisite infrasonic conditions for longer wavelength, lower frequency infrasound are far more likely to be met on a regular basis in coastal or mountainous regions at night. Nevertheless, it should be remembered that in a small island like Britain most natural and even anthropogenic infrasound will be more or less ubiquitous, hence it will mainly be the locations and field strengths of transmitters and radio frequency matching aspects which will be more critical for determination of the HUM in the majority of cases except wherein locally very large amplitude anthropogenic infrasound sources are active. Local or intense infrasound can under such circumstances reach the recipient’s body sensory organs directly, or even be conducted a vibration to the body where it could excite cavity resonances, as an aside from being modulated onto scattered electromagnetic waves causing sensory reinforcement if there is sufficient coherence of arrival.
Human beings employ sensory reinforcement in everyday perception for example, reinforcement of auditory perception by sight in a noisy environment (not unlike lip-reading by a deaf person) (Burke 2001). Even the semi-circular canals or vestibular apparatus may be involved in the synergy of the senses required for HUM perception. Lebovitz (1975) has sown this organ to be sensitive to weak electromagnetic fields ands is not inconsistent with the hypothesis presented here. Similarly involved in human balance, the organ contains the body’s gravity detection system. Airborne infrasound has also been shown to be associated with gravity perturbation (Saulson 1984) and so here we have yet another possible synergistic link. This is useful for it consoles the present work with the ideas of Dawes (2006). Within the vestibular apparatus of the inner ear lies the saccule which is said to contain piezoelectric material. Similarly this organ in some birds and fishes is said to contain ferromagnetic material. Birds use magnetic fields http://www.backyardnature.net/birdnavi.htm to navigate and also infrasound (Hagstrum 2001). Maybe our ability to perceive the HUM is buried deep within in the evolutionary path of development from our avian cousins.
Summary HUM factors at author’s residence
The most likely HUM factors and components at the author’s residence based on the above experiments are summarised in Table 3 below;
Table 3
|
SOUND |
ACOUSTIC |
BRAGG MATCHED |
STRONGEST POSSIBLE |
|
DIRECTION |
FREQUENCY HZ AND SOURCE |
R.F. RANGE MHZ |
R.F. SOURCE |
|
SE*/E* |
GAS GRID 5-9/31 HZ UNDERGROUND SPEED 7KM/S |
.125 /2.45 0.59-8.3 |
LONG/MEDIUM WAVE |
|
SE |
5-9 HZ Mountain infrasound/Pumped Storage Lake/Turbine/Gas main |
2.5-49.5 |
SHORT WAVE |
|
E |
24-31 HZ Gas pressure reduction station over ground SPEED 340m/s and/or Mountain/waterfall infrasound |
12.2 -135-171 |
VHF PAGING |
|
NE |
99.5 -155 HZ Electricity sub-station |
50.59-870 |
FM ,TETRA,TV, GSM |
|
N/S |
52-78 HZ Electricity sub-station / TETRA/ Plus Unknown acoustic source |
26-56 - 293-435 |
FM ,TETRA |
|
W |
20-30 HZ Bridge infrasound /Menai Suspension Bridge |
9.9-15.9 - 110-165 |
VHF PAGING |
|
SW |
29-38 HZ Bridge infrasound/ Britannia Bridge |
14.4-160-210 |
VHF PAGING |
What is certain is that when the frequency components which are driven by the jet stream, in all probability the mountain or other infrasound at frequencies between 5 and 31 Hz are not present, that is if the jet stream is absent or distant, the whole aggressive HUM disappears. These components are Bragg Matched mainly by Low Megahertz Short Wave signals which propagate best at night and will always be present along with all the other electromagnetic signals. Thus the HUM as perceived by the author cannot be purely electromagnetic.
It is very instructive to consider noise from a gas main travelling underground and through building structures with seismic, rather than air velocities. The longer wavelength of the sound makes a significant difference to the Bragg matching. It becomes much easier to see how long/medium wave radio broadcasts can be involved in HUM perception, see SE*/ E* Table 3. Such broadcasts have been found by the author to be a common dominator at many world Hum sites.
The HUM and vehicles
It has long been known that just as with houses, the HUM is often perceived by hearers much louder inside stationary vehicles. Typical car interiors resonate between 100 -200 Hz. Vehicle suspension resonances are typically of the order of 1 or 2 Hz and other mechanical parts have resonances around 10Hz, close that of mountain infrasound. VHF, UHF and microwave radio fields can enter vehicles relatively unimpeded through window glass whereas entry of lower radio frequencies and mains frequency fields would be confined to the magnetic component, whereas the electric components would have a tendency to excite the flow of eddy currents in the vehicle body. Vibration of the vehicle structure at eddy current frequencies may be another mechanism by which vehicles amplify the HUM. It is known that the magnetic components of electromagnetic field are most crucial for the HUM ( Barnes 1 and 2 (2007)) and this is borne out by people who still perceive the HUM in Faraday tents (Moir 2006) or in Faraday cages (Dawes 20076) wherein the electric component will be cancelled.
The HUM and electricity supply phases
Some mobile experiments were conducted at very rural locations outside Bangor where only one electricity supply phase was present in the form of overhead low voltage cables. Generally the HUM was not heard in a car at these locations even though the higher frequency electromagnetic pre-requisites were fulfilled. Only where three phase electricity supply was present then the HUM was heard. It would seem then criteria for the HUM is not only the electricity supply frequency but that it be present in three phases separated by 120 degrees. This will generate periodic electromagnetic and acoustic signals at mains frequencies and harmonic and sub-harmonic frequencies. 16, 33, 50, 66, 100 and 133 Hz etc. The hypothesis being, the more frequencies present, the more chance of Bragg matched beat frequency conditions and /or direct interaction with Mountain Infrasound. .
Concerned with power line electromagnetic sources, the author has recently been observing the behaviour of the local ELF spectrum with respect to power line harmonics with a piece of computer software known as Spectrum Lab. These harmonics often appear to vary in relative intensity during HUM episodes. It is hoped to report on their behaviour with special reference to the weather, space weather and the HUM at some later stage. Also during the period of writing, low and infrasonic frequencies could also be detected in the received and de-modulated audio spectrum of a least four different ionospheric heater signals ranging from 2.3 -6.9 MHz. Based on the frequency ranges involved, it is suspected these signals may be arising from EISCAT or similar. There remains a conjecture by some that ionospheric heating is a cause of or at least a contributing factor of the HUM. Soviet and European experiments on such heating certainly began about the same time major HUM reports in Britain commenced and continue to this day , see Ponomarev and Eruschenkov (1977), Karashthin et al (1977) and Rapoport et al (2003). Russian Scientists have recently succeeded in propagating artificial ULF signals over a distance of 1500 km (Bolyaev et al 2004). This starts to become significant as far as parts of the UK are concerned. Certainly in the light of this and the requirement for Bragg radio frequencies in the low MHz range to satisfy one of the HUM components at the author’s residence these ideas may be worth pursuing further.
Conclusions
The author believes this work now comes close to a solution to the perplexing problem of accounting for the generation and perception of the HUM. The ultimate solution will, perhaps, only come when Science has a far better understanding of infrasound, the atmosphere and wave-wave interactions. The following list of points is now more certain
· A comprehensive picture of the Taos type HUM has been presented.
· The HUM appears to be an electro-acoustic effect which requires a complex combination of electromagnetic frequencies and appropriate infrasonic cofactors for its perception.
· The HUM involves infrasound conducted into the human ear and body which appears to be enhanced by electromagnetic signals at the right ear in some individuals.
· The HUM could involve longitudinal electro-scalar waves.
· The HUM appears to be particularly enhanced when infrasound and electromagnetic atmospheric waves are of similar wavelength (equally matched to within an order of magnitude of each other depending on scattering angle and volume) causing Bragg reflection (scattering) of an electromagnetic component(s).
· In some cases local infrasound may enter the body at other places and act as to coherently reinforce the Bragg scattered electromagnetic radiation by duelling of the senses i.e. optical modulation or vibration of body cavities.
· The said infrasonic sources can be natural or anthropogenic but must be present sufficiently and with appropriate frequencies to account for the geographic distribution and temporal occurrence of the HUM
· Sometimes the perceived HUM level may be reinforced by visual experience under some atmospheric conditions due to atmospheric scintillation of certain celestial light sources
· Sometimes the perceived HUM level may be reinforced by radio or gravity field detection in the inner ear, ways in which seismic signals and power grid signals can modulate local gravity will be discussed by the author at a later date.
· It is presumed that the regions of the atmosphere giving rise to these scintillation effects do so in phase constructive manner with the electro-acoustic phenomenon to give such reinforcement. This is more likely in regions which suffer the HUM but also have clear air turbulence and mountain acoustic waves.
· Infrasonic
and/or acoustic sources may possibly be self -Bragg matched to the
electromagnetic frequencies involved for the HUM due to passive demodulation,
particularly so in the case of TETRA which has amplitude like modulation pulses
at or close to 17Hz. Thus certain types of digitally modulated
electromagnetic signal could under some circumstances produce their own hum
like effects.
· The most likely anthropogenic sound sources are the electricity turbines, power and gas grids and bridges, not forgetting the possibility of wind turbines; acoustic noise and LES waves from the electricity grid are perhaps the most ubiquitous of these followed by noise form the gas grid.
· The HUM does not take on the direct modulation envelope of any of the radio transmitters involved because as coherent detectors, humans require coherence times to respond to signals which outweigh rapid modulation periods.
Acknowledgements
The author wishes to acknowledge the aid of his wife Gwyneth as valuable experimental assistant and with whose infinite patience the preparation of this work and manuscript was possible.
References
Advanced noise solutions http://www.advanced-noise-solutions.co.uk/noise-nuisance.html
AMS Glossary http://amsglossary.allenpress.com/glossary/search?id=radio-acoustic-sounding-system1
Allen S.T. (1995) www.eskimo.com/~bilb/freenrg/sara.txt
Anisimov et al (2001) Mechanisms for the Formation of Electric-Field Pulsation Spectra in the Near-Surface Atmosphere, Radiophysics and quantum electronics, 44 (7) , 520-532, 2001.
Anritsu Application Note; Solving your Radio Frequency Interference Problems MS2721A
Aucan .J. et al (2006) Infrasound from large surf GEOPHYSICAL RESEARCH LETTERS, VOL. 33, L05611, doi: 10.1029/2005GL025085, 2006
http://www.backyardnature.net/birdnavi.htm
Barnes C. (2007) The Hum in Britain a Geographic Study leading to a New Causal Hypothesis of both UHF/Microwave and low frequency Magnetic Involvement. (Submitted to Journal of Scientific Exploration February 2007; JSE 07-009)
Barnes C. (2007) Active Prediction of Sites Prone to the HUM by Aharonov- Bohm Criteria
(Paper Submitted to Journal of Scientific Exploration February 2007); JSE 07-010
Barrick. D. (1972) First-order theory and analysis of MF/HF/VHF scatter from the sea, IEEE Trans. Antennas and Propagation, 20 (1) 2-10, 1972.
Bass, F. Fuks, I. Kalmykov, A. Ostrovsky, I. Rosenberg, A. (1968) Very high frequency radiowave scattering by a disturbed sea surface Part II: Scattering from an actual sea surface, Antennas and Propagation,, 16 (5) 560-568, 1968.
Bedard Jnr. A.J. (1978) Infrasound Originating Near Mountainous
Regions in Colorado American Meteorogical Socitey, 17 (7)
1014-1022.
Bedard Al. NOAA/ETL CHAPTER IX INFRASONIC SIGNATURES ASSOCIATED WITH TRANSIENT ELECTROMAGNETIC EVENTS fma-research.com
Belyaev, P.P. et al, First
experiments on Generating and Receiving Artificial ULF ( 0.30-12 Hz) Emissions
at a distance of 1500 km, Radiophysics and Quantum
Electronics, 45 (2), 135-146.
Bocharev N.N. (2005) Peculiarities in statistical characteristics of fluctuations of near-surface acoustic waves in the atmosphere, XVI Session of the Russian Acoustical Society, Moscow, November 14-18, 2005.
Bosinger, T ( 2000) Final Report of INTAS99-0335 project: The ionospheric Alfen resonator, ULF waves ( 01-10Hz) , and particle phenomena in near-Earth environment, started on 1st July 2000, Department of Physical Sciences, University of Oulu.
Burke B.J. (2001) Duelling Senses Hearing and Vision and How They Work Together , Comm 141, Term Project, April 19th ,2001, www.unc.edu/~jimlee/BrentBurkeHearingandVision.htm
BWEA –UKWED Operational Wind Farms, 1 Azytec Road, Berners Row, LONDON N1 0PW
Casperson, L.W. Waterfall Lasers, Journal of Applied Physics, 82 (10), 4727-4731.
Chilson P.B. et al (2000) First artificially induced modulation of PMSE using the EISCAT heating facility, Geophysical Research Letters, 27, Issue 23, 3801-3804.
Chimonas G. (1977) A Possible Source Mechanism for Mountain-Associated Infrasound, Journal of the Atmospheric Sciences, 34 (5) 806-811.
Colson
D. (1961) ANALYSIS OF CLEAR AIR TURBULENCE DURING APRIL 1960 AMS
Monthly Weather Review, 89 (3), 94-98.
Cowan J.P. (2003) The Kokomo Hum Investigation, Acentech Report No. 61541111, Acentech Inc. 33 Moulton Street, Cambridge, MA. 02138.
Cowen R. (1998) Clearing the Air About Turbulence A fearful flier’s foray , Science News 153, (26),408.
Cowen R.C. (2003) Eerie feeling? Maybe you’re just hearing things, Science and space, September 18th 2003, www.csmonitor.com
Das J. et al (1989) Diffraction patterns observed in VHF signal propagation, Indian Journal of Radio and Space Physics, 18, 10-13.
Dawes J. (2006) http://homepages.tesco.net/~John.Dawes2/gravity.htm
Dekker P.L. et al (2000) VTMX Field Campaign, Microwave Remote Sensing Laboratory, University of Massachusetts.
Delyukov A.A and Didyk L. (1999) The effects of extra-low-frequency atmospheric pressure oscillations on human mental activity , International Journal of Biometeorology , 43 (1) 31-37.
Deming, D. (2004) The
Hum: An Anomalous Sound Heard Around the World. Journal of Scientific
Exploration. 18(4) 571-595.
Domm and Balachdran (1972)
Atmospheric Infrasound, 10 to 0.1 Hz, JASA, 51 (1A) ,136.
Donn W.L. et al (1974) Atmospheric infrasound radiated by bridges, JASA, 56 (5),
1367-1370.
Drob D.P The Effect of Atmospheric
Variability on Infrasound Propagation Eos Trans. AGU, 84(46), Fall
Meet. Suppl., Abstract U32B-05, 2003
Ellrod G.P. and
Knox J.A. (2005) An improved clear air turbulence diagnostic index to
account for unbalanced flow in anticyclonically
curved jet streams21st Conference on Weather Analysis and Forecasting/17th …,
2005 - ams.confex.com
Evers (2003) http://www.knmi.nl/~evers/infrasound/events/030818/030818-eng.html.
Fomichev V.V. and Fainshtein S.M. (1981) On a possible mechanism of zebra pattern generation in solar radio emission, Solar Physics, 71 (2), 385-393.
Fox B. (1989) Low frequency ‘Hum’ May Permeate the Environment, New Scientist, December 9th , 1989, p27.
Garstang M. et al (1995) Atmospheric controls on elephant communication, J Exp Biol. Apr; 198(Pt 4):939-5
Guardian (The) October 18th 2001
Haak H ‘Probing the Atmosphere with Infrasound, Infrasound as a tool for CTBT verification’, Hein Haak heads the Division of Seismology at the Royal Netherlands Meteorological Institute.
Hagstrum J.T. (2001) Infrasound and the Avian Navigational Map, Journal of Navigation, 54, 377-391, Cambridge University press.
Hanington et al (1999) G Hanington, PF Chen, PM Asbeck, LE Larson - Microwave Theory and Techniques, IEEE Transactions on, 1999 - ieeexplore.ieee.org, 47 ,8 ,1471-1476.
Hickson P. and Lanzetta K. ( 2004) Measuring Atmospheric Turbulence with a Lunar Scintillometer Array , The Astronomical Society of the Pacific,116 , 1143–1152.
Hoffman N.( Los Alamos National Laboratory) ‘ Wave –Matching Conditions for Acoustic –Gravity Wave Interactions.
Hu .X. et al (2002) A numerical study of wavelike Motion in Forests, Boundary Layer Meteorology, 102 (2), 199-223.
Keerthipala W.W.L et al (1998) Electronic circuits for active control of acouistic noise generation in voltage transformers, Power Electronic Drives and Energy Systems for Industrial Growth, 1998 Proceedings International Conference On. 1, 243-248.
Inness Seminar s6 , www.met.rdg.ac.uk/~swshargi/MT11B/MT11B_S6.pdf
Irvine T. (2007) Vibrationdata, January 2007 Newsletter.
Jones, R.M.
CIRES/Univ. of Colorado, Boulder, CO; and E. S. Gu
and A. J. Bedard, Jr., Infrasonic atmospheric
propagation studies using a 3-D ray trace model P2.9 http://ams.confex.com/ams/pdfpapers/81665.pdf Poster Session 2, 22nd Conference on Severe
Local Storms HAZARD MITIGATION, SOCIETAL IMPACTS, AND WARNINGS Monday, 4 October 2004, 3:00 PM-4:30 PM
Karashtin A.N. et al (1977) Generation of sound in the ionosphere by powerful radio waves, Radiophysics and Quantum Electronics, 20 (5) 540-542.
Kelly N.D. et al, Comparison of acoustic emission characteristics of three large wind turbine designs Proc. - Int. Conf. Noise Control Eng. ; 1; International conference on noise control engineering; 17 May 1982; San Francisco, CA, USA
Khvorostenko N.P. (1992) A hypothesis for the possibility of longitudinal electromagnetic waves in arbitrary media, Russian Physics Journal, 35 (3) 223-227.
Koshovyy et al Acousto-electromagnetic investigations of acoustical channel of Lithosphere-Ionosphere interaction.
Kulichov S.N. (2004) Long range propagation and scattering of low frequency sound pulses in the middle atmosphere, Metrology and Atmospheric Physics, 85 (1-3) 47-60.
Laine U.K. (2004)
De-noising and analysis of audio recordings made during the April 6 -7 2000
geomagnetic storm by using an ad hoc set up, Joint Nordic-Baltic
Acoustics Meeting, 8-10th June 2004,
Mariehamn, Aland.
Lawrence D.E. and Sarabandi K. (2006) Electromagnetic scattering from vibrating penetrable objects using a general class of time-varying sheet boundary conditions, IEEE Transactions on antennas and propagation, 54 (7), 2054-2061.
Lebovitz, R.M. ( 1975)
Detection of weak electromagnetic radiation by the mammalian vestibulo- cochlear apparatus, Annals of the
New York Academy of Sciences 247 (1), 182-193. doi:
10.1111/j.1749-6632.1975.tb35995.x
Lees J.M. et al
2006 Volcanic eruptions, lightning, and a
waterfall: Differentiating the menagerie of infrasound in the Ecuadorian jungle, GEOPHYSICAL RESEARCH
LETTERS, VOL. 33, L06308, doi:10.1029/2005GL025515, 2006
Leventhall G. (2003), DEFRA Report on Low Frequency Noise.
Liddle R.(2003) Scientist to create haunted house , Guardian Unlimited , Thursday 24th July 2003
Lui P.L. (1990) Passive intermodulation interference in communication systems, Electronics & Communication Engineering Journal, 2 (3) 109-118.
Lui,
P.L. Rawlins, A.D. Watts, D.W.
Electron. Eng. Labs., Kent
Univ., Canterbury; Measurement
of intermodulation products generated by structural
components, Electronics Letters, 24 (16), 1005-1007.
Lui Z., Hill D.L. Centrifugal Compressor Noise Reduction by Using Helmholtz Resonator Arrays, Dressler Rand, Olean, NY, USA.
Lyakhov G.A and Suyazov N.V (1998), Electromagnetic excitation of infrasound in a
conducting medium Zh. Tekh. Fiz.
68, 80–83.
Maeda K. and
Watanabe T. (1963), Pulsating Aurorae and Infrasonic Waves
in the Polar Atmosphere, AMS , Journal of the
Atmospheric Sciences, 21 (1) 15-29.
Maeda K. and Watanabe T. (1964), Infrasonic Waves from the Auroral Zone- NASA technical note, June 1964.
Mayer, H. (1989) Windthrow, Phil.Trans. Soc. Lond. B324, 267-281.
Medeiros E.B. et al (2001) Controlling Noise in Electricity Substations , INTERNOISE 2001, Proc. Intl. Conf. and Exchange on Noise Control Engineering, 2001.
Matani, Y. et al (2002) Correlation between scintillation of laser beam and wind noise, Proceedings of the 41st SICE Annual Conference, 2002 - ieeexplore.ieee.org 3 1881-84.
Mityakov N.A ( 2006) Parametric acoustic antenna in the atmosphere Izvestiya Vysshikh Uchebnykh Zavedenii, Radiofizika,. 49, No. 7, 570–576, July 2006.
Moir T. (2006) http://www.massey.ac.nz/~tjmoir/hum.html
Moir T. (2007) Personal Communication email, March 2007.
Moller F. Report on the Humming Noise ( in German) Frank Moller, Hamburg, Germany Version 5 March 10, 2005. http://www.comlink.de/cl-hh/f.moeller/bericht%20ueber%20das%20brummen/report%20on%20the%20humming%20noise%20v5-0.pdf
Mutschlecner and Whitaker (1990) An empirical study of infrasound propagation, osti.gov OSTI ID: 15133.
Naugolnykh K. and Rybank S. (2005) Sounds of cyclone, Geophysical Research Abstracts, 7, 00333, 2005.
New Scientist (1992) ‘Hum Test’ Issue 1823 page 11.
http://www.newscientist.com/article/mg13518321.000-factories-and-traffic-blamed-for-the-hum-.html),
Nishiyama, R.T. Bedard, A.J., Jr. Kirschner, A.L. Nat. Oceanic & Atmos. Adm., Colorado Univ., Boulder, CO; Strong winds over mountains and infrasound: possible applications for detecting regions related to aircraft turbulence reports, Geoscience and Remote Sensing Symposium, 2002. IGARSS '02. 2002 IEEE International
Nutzel B. et al (1993) Acoustic and Microwave backscattering of the sea surface , OCEANS apos, 2 (18-21) , 11-13.
Pavlov V.I. and Sukhorukov A.I. (1985) Emission of acoustic transition waves, SOV PHYS USPEKHI, 1985, 28 (9), 784-802.
Ponomarev E.A. and Erushchenkov A.I.
(1977) Infrasonic Waves in the Earth Atmosphere /Review, Radiophysics and Quantum
Electronics, UDC 551.501.8 ... 12, pp. t773-1789, December, 1977
Posmentier E.S. (1973) Infrasound of 1 through 16 Hz
Associated with Clear Air Turbulence, JASA , 53
(1) ,372.
Qiang Wu et al (1996) Microwave Symposium Digest, 1996., IEEE MTT-S International, 1996 - ieeexplore.ieee.org 2 851-854.
Radford T.(2003) Silent Sound hits emotional chords, Guardian Monday September 8th 2003
Randle A.M. (1999) Dynamic Radio Channel Effects from L-Band Foliage Scatter , D-Phil Thesis, Communications Research Group, Department of Electronics , University of York.
Rapoport V.O .et al (2003) The possibility of active experiments with artificial monochromatic infrasound waves on ionospheric altitude, Geophysical Research Abstracts, 5 , 03105, 2003.
Rapoport V.O .et al (2005) Electro-acoustic sounding of the atmosphere, Radiophysics and Quantum Electronics, 48 (1), 29-33.
Reddy L.R.G and Reddy B.M. (1993) Fading patterns and physical mechanisms associated with deep powerfading observed on LOS microwave radio links, Antennas and Propagation, 1993., Eighth International Conference, 660-664 vol.2.
Reiter E.R. (1963) A case study of clear-air turbulence, Meteorology and Atmospheric Physics, 13 (3-4) 379-389.
Rind
and Donn (1975) Further Use of Natural Infrasound as a Continuous Monitor
of the Upper AtmosphereJournal
of the Atmospheric Sciences - ams.allenpress.com 32
(9) 1699-1704.
Roero,C. and Teich, T.H.,(2004) 4th International Symposium on Contact
Angle, Wettability and Adhesion,Phila- delphia, USA, 2004.
Rottger J, ST radar observations of atmospheric waves over mountainous areas: a review Annales Geophysicae 18 (7) 760-765, 2000
Rozell (1995) http://www.gi.alaska.edu/ScienceForum/ASF12/1221.html
.
Saebbo J. Estimation of Wind and Turbulence in The Lower Atmosphere with a Bistatic Radio Acoustic System, Triad AS, PO BOX 89, 2001 Lillestrom, Norway.
Saulson, P. (1984) Phys. Rev. D. 30, 732-736.
Science Frontiers Online (
2000) Listening to the unbearable No. 131 SEP-OCT 2000.
See,S.P., Cai,A
and Zhi NC , (2007) Study on Transmission of RF
signals on the Human Body. Institute for Infocomm
Research 20 Science Park Road, #02-21/25 Teletech Park ,
Singapore 117674.
http://serendip.brynmawr.edu/exchange/node/90).
Sim C.Y.D and Warrington E.M. ( 2006), Signal strength measurements at frequencies of around
300 MHz over two sea paths in the British Channel Islands, Radio Science, 41, ( 3) , CiteID RS3005
(RaSc. Homepage
)
Slaton W.V. and Zeegers J.C.H. ( 2005) , Acoustic
power measurements of a damped aeroacoustically
driven resonator, JASA, 118 (1) 83-91.
http://www.spacedog.biz/infrasonic.htm
Tektronix Application Note
‘Interference Testing Fundamentals’ www.tektronix.com/mobile
Terradaily Washington D.C. ( spx) Ocober
19th 2005 ‘ Mountain Wins may Create Atmospheric
Hotspots’
Thomas S. ‘Detect Interference in wireless nets’ , Anritsu Corp.
Tokovin A. and Bustos
E. (2006) Single-channel lunar scintillometer , Version 2,
Sep 11, 2006,
Townsend M. (2005)
A Haunted Bed, Anomaly 37, 2005.
Vaivods (2002) http://members.tripod.com/~auroralsounds/#dir).
Wikipedia.org (2007) Clear-Air
Turbulence
Wikipedia.org/ wiki/ Rocky_Mountains
Wikipedia.org/ wiki/ Multipath
Wilson C.R. et al (2005) High –trace velocity infrasound from pulsating Aurora
at Fairbanks, Alaska,
Geophysics Res. Letts. 32, 1 14810, doi: 10.1029/2005GL023188 ,2005.