Using Chernobyl to more accurately define the latency periods of different types of Cancer in the UK - By Dr Chris Barnes, Bangor Scientific and Educational Consultants, Bangor, Gwynedd, Wales, UK. E-MAIL doctor.barnes@univ.bangor.ac.uk
Dr Barnes Homepage http://www.drchrisbarnes.co.uk
Introduction
Cancer latency is the period between carcinogenesis when the first few cancer cells form to the period when the cancer presents as a tumour sufficiently large to be felt by palpation, or if it is inaccessible to palpation then for it to be large enough to show up on body imaging scans.
Cancer latency is of interest for various reasons. Firstly, because it is linked inversely to tumour proliferation rate, see Olsson et al 2003 (1). Secondly, because it is linked to detection , see Koenty (2005) and Benoit (1995). Thirdly, for some cancers such as mesothelioma it is related to initial asbestos exposure and to lifespan (2).
To the present author, it would seem obvious that cancer latency would be related to the promoter as well as to the initiator, see for example Barnes' 2013 study on TV emissions and pollution (3) but despite this there is relatively little in the literature on similar matters. The two notable exceptions are Ewing et al (1988)(4) who show that for mouse skin tumour progression both initiator and promoter concentrations can influence tumour progression rates. Wong (2003) also shows that mixed hormonal promoters shorten rat breast tumour progression rates.
It would seem that minimum latency periods are observed when there is human exposure to a very aggressive mixture containing both initiators and promoters. An tragically sad, yet almost unique opportunity to follow such an event was due to the dust inhaled by some persons when the world trade towers in New York came down, so called 9.11. Howard, (May 2013) has given a revision of his recent White Paper on 9.11 showing the minimum expected latency periods for a variety of cancers (5).
Another event that effected the whole world but moreover Ukraine and parts of Europe and Britain very badly was the Chernobyl nuclear accident in 1986. Due to the Easterly winds and unusual direction of weather systems at the time, Britain, especially the Lake District and North Wales was effected a day or two later by radioactive rain containing mainly radioactive Caesium and Iodine.
Ionising radiation from the Chernobyl fallout would have been a remarkably good and consistent tumour initiator for an exposed and susceptible section of the public no matter how small by either inhalation or ingestion of polluted water, milk, vegetables or meat.
Chernobyl methodology and logic
The notion is that the effect of Chernobyl should show up as a positive going blip in the cancer versus time trend statistics. The initiation or rising edge of this blip should yield the minimum latency time a particular type of cancer and the falling edge should yield the maximum time. Fortunately, Cancer Research UK website has published data on all sorts of cancers trends against time.
Further taking on board the work of Howard (2013) it would seem that Leukaemia should have the shortest latency period, potentially as little as 146 days. Thus we need to look for a positive blip in Leukaemia as soon after May 1986 or the date of the Chernobyl accident as can be seen.
Results and Discussion
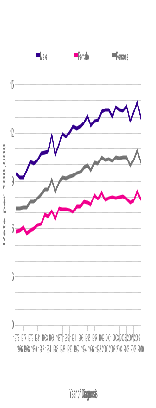
The trends over time between 1975 and 2010 are shown for each of five common cancers against Leukaemia as a reference, see figure 2-5 below.

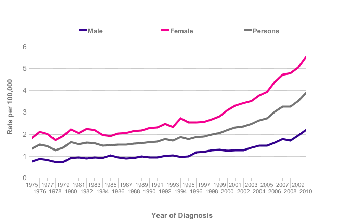
Leukaemia Thyroid
Figure 1

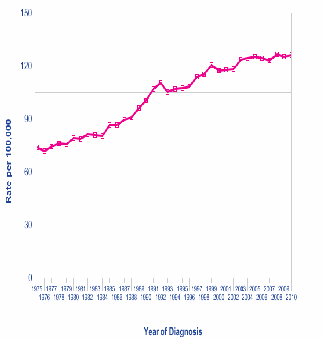
Leukaemia Invasive Breast
Figure 2
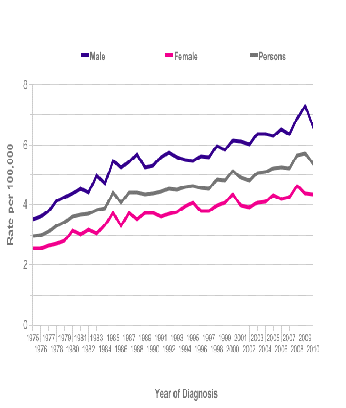

Leukaemia
Myeloma
Figure 3
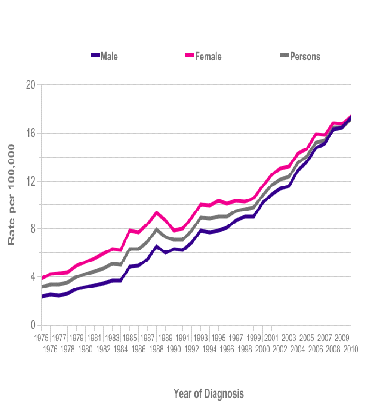

Leukaemia
Malignant Melanoma
Figure 4

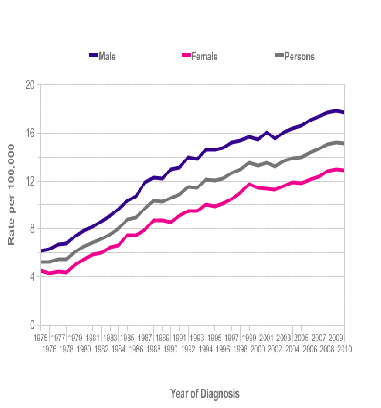
Leukaemia
Non-Hodgkin Lymphoma
Figure 5
Surprisingly it can be seen that just prior to 1986, the rate of Leukaemia was falling sharply after a spike. The event at Chernobyl seems to have triggered, almost immediately, a new spike. This is consistent with Leukaemia having a very short latency period.
In figures 1-4 for the cancers; thyroid, invasive breast, myeloma and malignant melanoma, virtually the same double step feature as for Leukaemia can be picked out but delayed and stretched in time according to the specific cancer. This would be expected firstly if the same process which gave rise to a fall in Leukaemia pre 1986 was relevant to other cancers and if the radiation burst from Chernobyl also contributed towards the rate of carcinogenesis in other cancers which would not be seen immediately in the statistics due to the latency time delay.
In figure 5 for Non -Hodgkin Lymphoma the step pattern is less clear and either a 2 or 6 year delay or dual latency period is evident. It is virtually impossible to decide which to use.
To incorporate graphical illustrations of all the common cancers would prohibitively lengthen this paper and not significantly add to the weight of evidence presented. However, the reader should be assured that the author has made such observations and has plotted and extrapolated such data. The overall data obtained for both the published and non-published graphical evidence is easiest to present in table form, see figure 6 below.
|
Cancer |
Common Texts |
9.11 minimum |
This study |
Texts SD |
Study SD |
|
yrs |
yrs |
yrs |
|||
|
Bladder |
10.00 |
4 |
4.5 |
4.2 |
0.7 |
|
Bone |
20 |
4 |
4 |
11.3 |
1.4 |
|
Bowel |
7.5 |
4 |
9 |
14.4 |
1.4 |
|
Brain |
15 |
4 |
12.5 |
5 |
2.1 |
|
Kidney |
37 |
4 |
9 |
16 |
0.1 |
|
Larynx |
25 |
4 |
3.5 |
7 |
3.5 |
|
Liver |
20 |
4 |
14 |
4.2 |
8.5 |
|
Melanoma |
n/a |
n/a |
5 |
NO DATA |
NO DATA |
|
Myeloma |
20 |
4 |
4 |
8.5 |
2.8 |
|
Oesophagus |
12.5 |
4 |
6.5 |
10.6 |
4.9 |
|
Oral |
10 |
4 |
6.5 |
4.2 |
4.9 |
|
Ovarian |
8 |
4 |
8 |
14.5 |
0.1 |
|
Pancreas |
10 |
4 |
3.5 |
4.2 |
3.5 |
|
Prostate |
20 |
4 |
13.5 |
6.8 |
3.5 |
|
Stomach |
11.3 |
4 |
3 |
4.8 |
2.8 |
|
Testicular |
8 |
4 |
8 |
3.8 |
5.6 |
|
Thyroid |
6.4 |
4 |
7 |
4 |
0.1 |
|
|
|||||
|
MEAN SD |
7.7 |
2.9 |
|||
As borne out by both the graphical evidence and the numeric standard deviations, for all but three of the seventeen common cancers considered the 'Chernobyl method' seems to produce more consistent estimates of cancer latency periods than those reported in a fairly scant literature, inclusive of the 9.11 document. The odd ones out were Oral, Liver and Testicular cancer. Even with these three cancers, the latency periods are statistically in agreement with what has been published elsewhere it is simply that the measured standard deviations are slightly greater. This may be due to different spreads of disease in the UK and elsewhere or it may simply be that these three cancers were not as directly affected by the Chernobyl radiation burst as were the others considered.
The method seems to give a very sharp response for cancers of the excretory system, especially the Kidney and of the Thyroid and of the Ovary. Use of radiation in anticancer treatments is known to have lasting effects on the ovary so presumably it is a good concentrator of ionising radiation (6). The thyroid of course would have concentrated radioactive iodine in exposed individuals at the time of the Chernobyl incident. The Kidney is a mainstay of the excretory system and at least in cows has been shown to concentrate the most radioactive Caesium after the Fukushima disaster, see Sasaki et al 2012. (7).
The general latency values obtained for this study are statistically invariant with previously published data other than for Bone, Kidney and Larynx cancer and all are also statistically closer to the 9.11 minimum values than mean values published elsewhere. Although studies suggest radioactive caesium uptake by bone in animal studies is not as great as other body tissues it is know to cause severe bone aplasia in humans (8) so this might possibly account for the latency discrepancy.
It is believed that for Kidney this study represents a more realistic result for radiation induced kidney carcinogenesis by ingestion than any previously available.
Finally, the discrepancy for Larynx cancer can be explained because the test book values refer only to HPV virus induced larynx cancers and not radiation induced cancers.
Conclusions and Further work
It is believed the Chernobyl incident although tragic has allowed, via this study, a significant number of common cancer latencies to be calculated with a significant degree of certainty. Cotterill et al (2001) have commented on Chernobyl and Thyroid Cancer in the UK (9) but it is believed this is the first time its relevance to a great variety of different cancers has been highlighted by the power of the minimum latency technique.
Cancer latencies will perhaps not be expected to be exactly the same in all parts of the world due to multiple factors including for instance but not exhaustible; genetics, diet, environment especially promoters and promoters. The figures presented here represented best averages for the UK in an appropriate slice of time.
Cancer rates in the UK and in many parts of the world are continuing to rise. There is much controversy surrounding the possible role of RF radiation and modern broadcasting and telecommunication systems in carcinogenesis. In the very near future it is proposed to extend this present method in order to see if it can elucidate incite in this exciting and ever complex conundrum.
References
Olsson (2003) http://www.biomedcentral.com/1471-2407/3/11
Ewing et al (1988)http://cancerres.aacrjournals.org/content/48/24_Part_1/7048.short
Sasaki et al 2012.http://www.ncbi.nlm.nih.gov/pubmed/22878206.
http://toxnet.nlm.nih.gov/cgi-bin/sis/search/a?dbs+hsdb:@term+@DOCNO+7389
Cotterill et al (2001) http://www.ncbi.nlm.nih.gov/pubmed/11334728